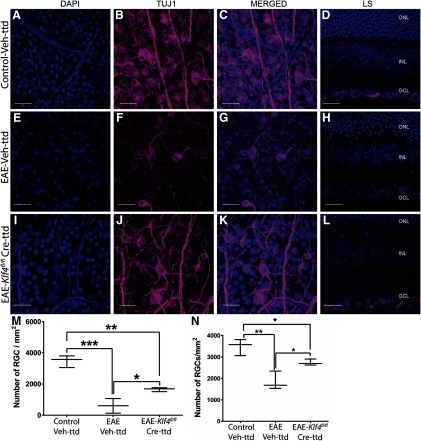
Figure 4.
Retinal whole mounts and longitudinal sections: confocal microscopy of retinal whole mounts and corresponding longitudinal sections of (A–D) control-Veh-ttd, (E–H) EAE-Veh-ttd, and (I–L) EAE-Klf4fl/fl-Cre-ttd mice showing. (A, E, I) DAPI-positive cell nuclei, with (B, F, J) Tuj1-positive RGCs, along with (C, G, K) DAPI and Tuj1 merged images and (D, H, L) representative retinal longitudinal sections with DAPI- and Tuj1-positive RGCs. Box and whisker plot (M) compare the RGC counts in control-Veh-ttd, EAE-Veh-ttd, and EAE-Klf4fl/fl-Cre-ttd mice groups, in which ntravitreal injections were done after the PERGs were significantly decreased due to EAE. N, Compares the RGC counts in control-Veh-ttd, EAE-Veh-ttd, and EAE-Klf4fl/fl-Cre-ttd mice groups, in which intravitreal injections and EAE sensitizations were done simultaneously. Box-plot elements include, center line, median; box limits, upper 75th and lower 25th percentile of the data; whiskers, lowest and highest data points. ONL, outer nuclear layer; INL, inner nuclear layer; RGC, RGC layer. Statistical analysis was performed by one-way ANOVA followed by Tukey’s multiple comparison test, p < 0.05 is considered to be statistically significant; *p = 0.01–0.05; **p = 0.001–0.009, ***p = 0.0001–0.0009; n = 3 eyes/group. Scale bars: 100 μm.Figure Contributions: Venu Talla acquired the images. Rajeshwari Koilkonda did the RGC counting. Venu Talla generated the figure.

