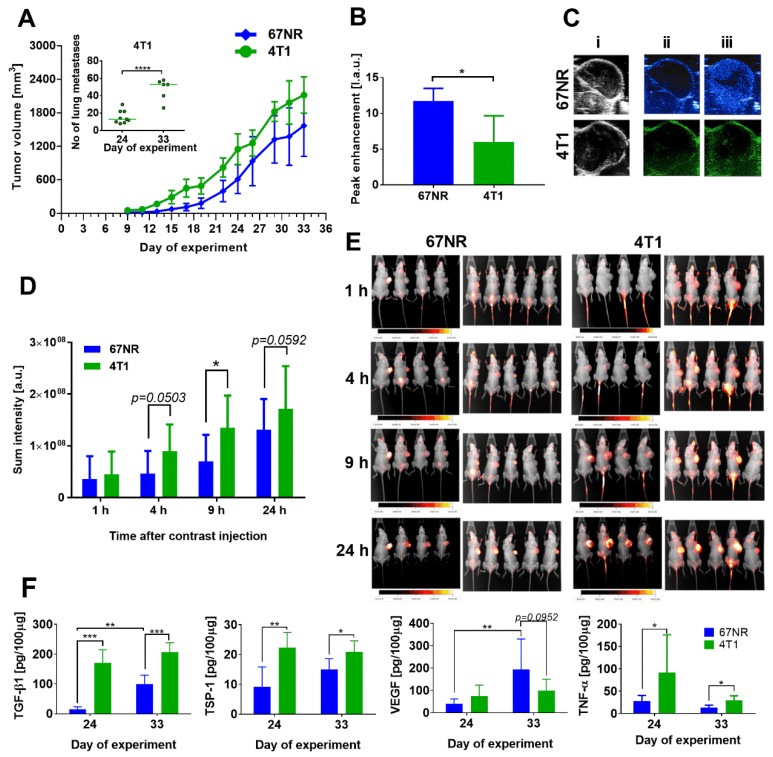
Figure 1.
Basic characteristics of 67NR tumors compared to 4T1 mouse mammary gland tumors in 6- to 8-week-old mice. (A) Tumor growth kinetics of 67NR and 4T1 cancer and in inserted graph: number of metastases on 2 steps of 4T1 tumor progression. (B) Analysis of tumor blood perfusion: peak enhancement parameter. (C) Representative pictures of (i) Ultrasonography (USG) image, (ii) tumors before contrast agent injection, (iii) tumors maximally filled with the contrast agent. (D) Blood vessel permeability: fluorescence of IRDye® 800CW fluorescent dye PEG Contrast Agent. (E) Pictures of X-ray and fluorescence images of mice. (F) Tumor tissue level of transforming growth factor β1 (TGF-β1), thrombospondin 1 (TSP-1), vascular endothelial growth factor (VEGF), and tumor necrosis factor α (TNF-α). Data presented as mean ± SD or data for individual mice (insert in figure A). Number of mice per group: (A) 6–9; (B) 3–4; (D) 9; (F) 5. Statistical analysis: Tukey’s multiple comparison test * p < 0.05, ** p < 0.01, *** p < 0.001, **** p < 0.0001.

