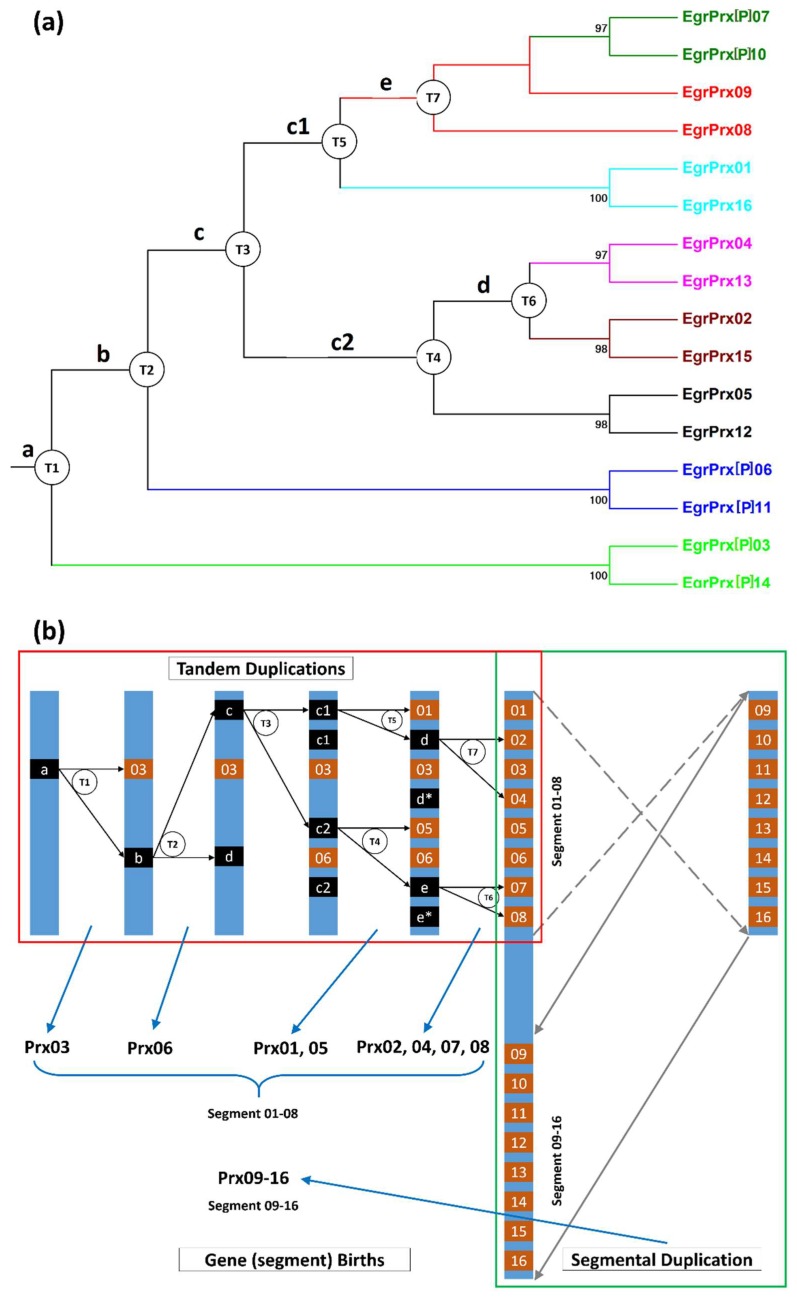
Figure 5.
Phylogenetic relationships and hypothetical evolutionary histories of two duplicated segments. (a) Phylogenetic tree of the 16 genes. Genes were given different colors according to the colors in Figure 5. The percentage of trees in which the associated taxa clustered together is shown next to the branches. The alignment was performed by MAFFT and the tree was visualized by Mega 6. Cycled letters T with following numbers represent the TD events; (b) Schematic diagram of the evolutionary histories of the 16 genes. The putative TD process was visualized in the red rectangle while the SD process in green rectangle. Genes shown with black rectangles (named a, b, c, d and e) represent the ancestors of some CIII Prx genes appeared in the evolutionary process. Asterisk (*) represents the alternative localization of the ancestral gene named with the same letter. T1–T7 represent the tandem duplication events. 1–16 represent Prx01–16. The dotted arrow (grey) in B shows the reversing process of gene segment while the grey arrow represents the genomic insertion event. Cycled letters T with following numbers represent the TD events. The order of gene apparition (genes Prx01–16) was displayed on the lower left corner. Gene sizes are not up to scale.

