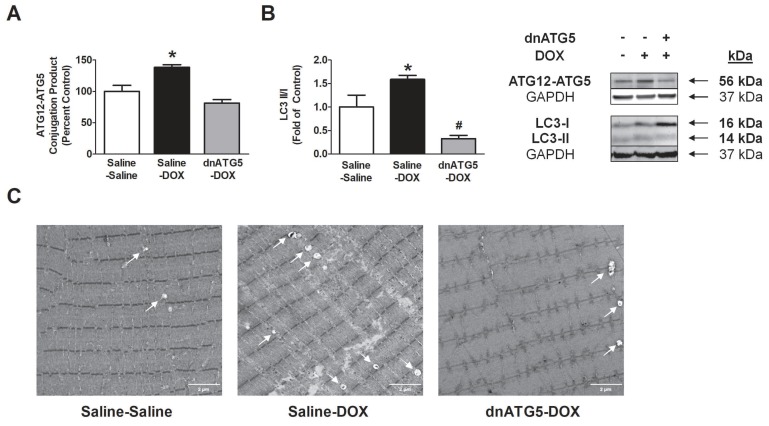
Figure 2.
Protein expression of (A) the ATG12-ATG5 conjugation product and (B) light chain 3 (LC3)-II/I ratio. Values are represented as means ± SEM. Representative Western blot images are shown to the right of the graph. * significantly different versus all groups (p < 0.05). # significantly different versus Saline-Saline (p < 0.05). (C) Representative soleus muscle electron microscopy images. White arrows within each soleus muscle image indicate autophagic vacuoles. Soleus ultrastructure appears identical between the Saline-Saline and dnATG5-doxorubicin (DOX) groups.

