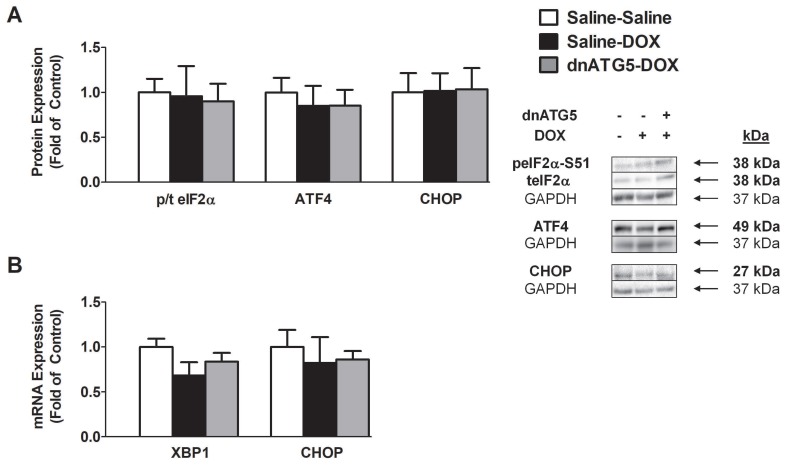
Figure 4.
Markers of endoplasmic reticulum stress in the soleus muscle. (A) Ratio of phosphorylated to total eukaryotic translation initiation factor 2 subunit 1 (eIF2α) (p/t eIF2α), activating transcription factor 4 (ATF4) protein expression, and C/EBP homologous protein (CHOP) protein expression. (B) mRNA expression of x-box binding protein 1 (XBP1) and CHOP. Values are represented as means ± SEM. Representative Western blot images are shown to the right of the graph.

