Figure 2.
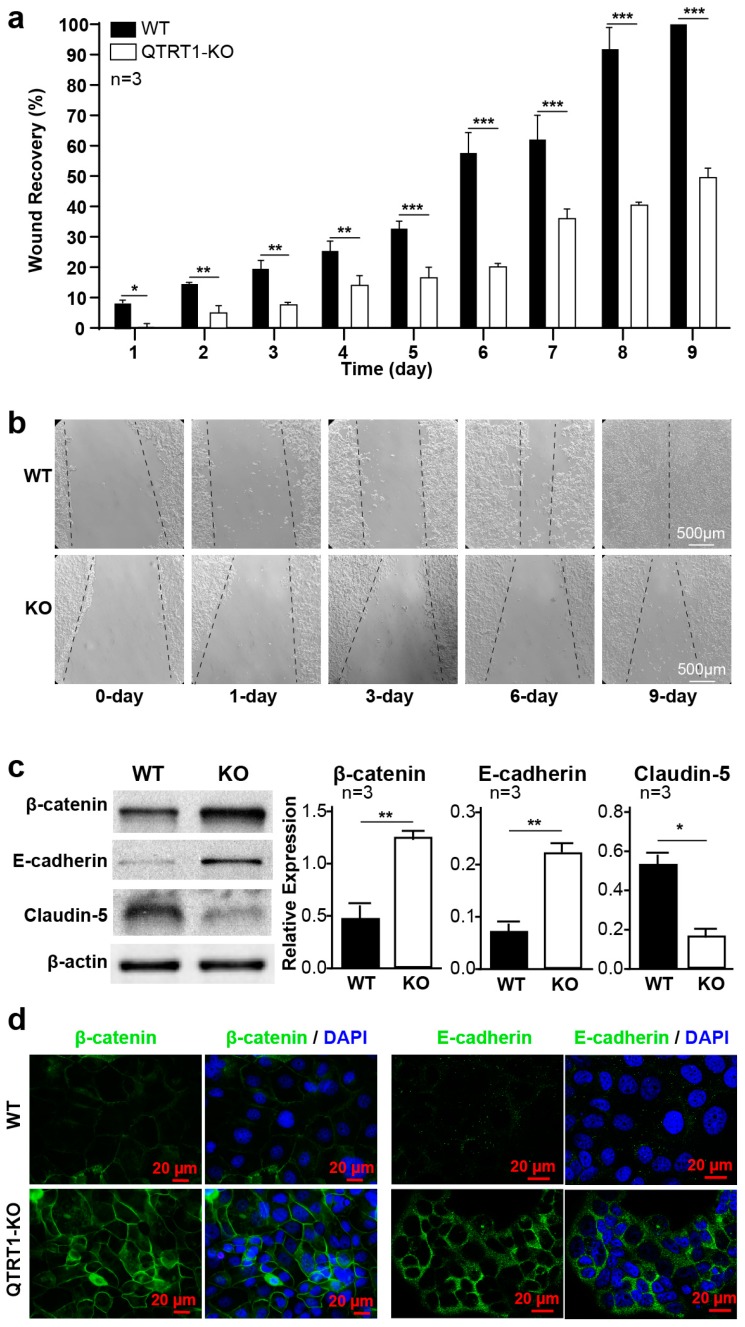
Knockout of QTRT1-suppressed cell migration and altered cell adhesion and tight junctions. (a) Wound healing analysis of wildtype and QTRT1-KO MCF7 cells was shown as the percentage of scratch closure at day timepoints. Mean ± SD, n = 3; * p-value < 0.05, ** p-value < 0.01, *** p-value < 0.001, two-tailed Welch’s t-test. (b) Representative wound healing images were shown. Scale bar is 500 µm. (c) Western analysis of tight junction protein E-cadherin, β-catenin, and caludin-5 was performed on QTRT1 knockout and WT MCF7 cells. Mean ± SD, n = 3; * p-value < 0.05, ** p-value < 0.01, two-tailed Welch’s t-test. (d) E-cadherin and β-catenin immunofluorescence staining showing the protein expression in QTRT1-KO MCF7 cells compared with WT cells. Proteins and DNA were stained with mouse monoclonal anti-β-catenin/E-cadherin and anti-mouse Alexa Fluor 488 antibody and DAPI, respectively. Scale bar is 20 µm.

