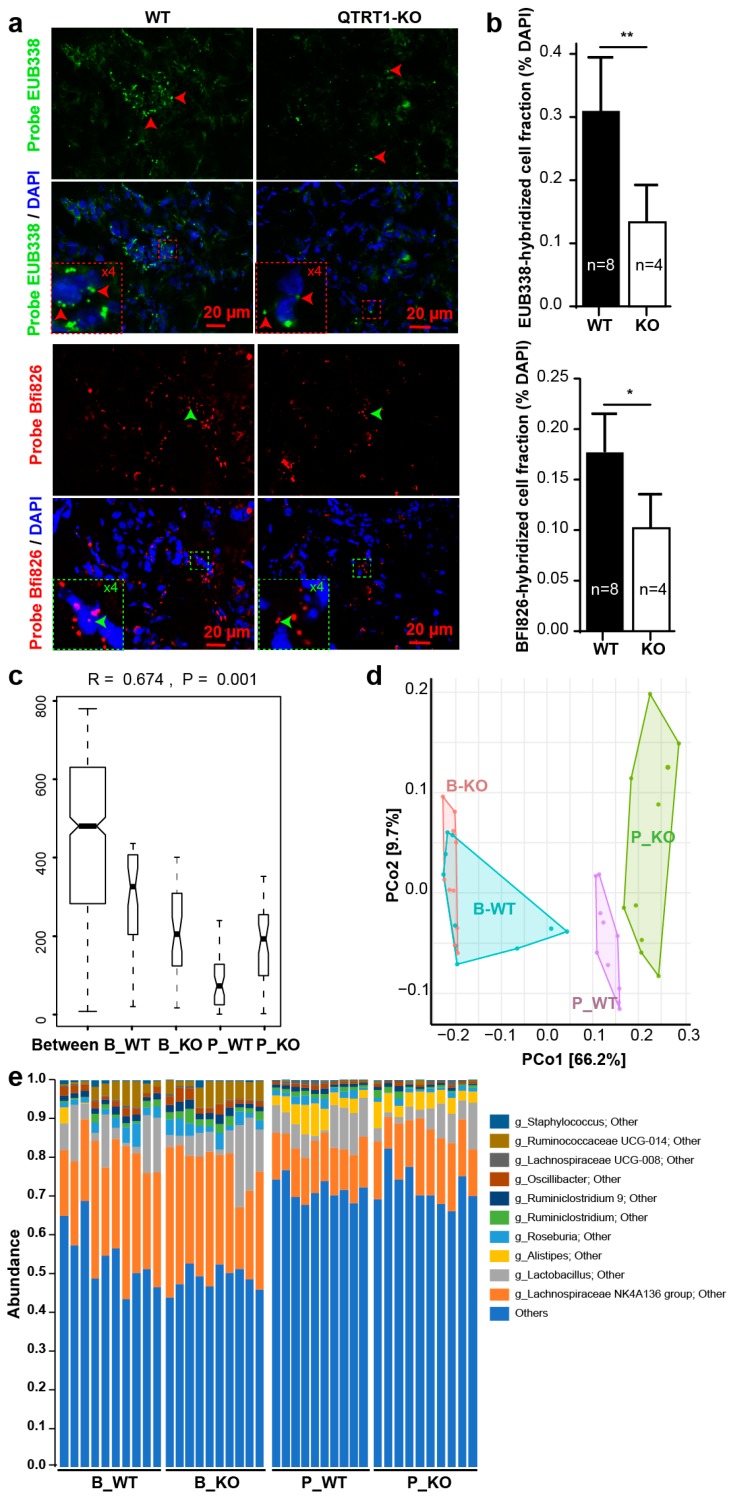
Figure 4.
Altered microbiome in tumors and intestines of nude mouse model. (a) Fluorescence in situ hybridization [4] staining with DAPI, EUB338, and Bfi826 [20] of the tumors from the nude mice injected with wildtype and QTRT1-KO MCF7 breast cancer cells. Scale bar is 20 µm. (b) Relative bacteria staining was calculated as probe-hybridized cell / DAPI-stained cells. Mean ± SD n = 7 or n = 4; * p-value < 0.05, ** p-value < 0.01, two-tailed Welch’s t-test. (c) Plots of between and within means of Bray–Curtis dissimilarity. The analysis of similarity (ANOSIM) was performed on between (Between) and within groups of before QTRT1-KO cell injection (B_KO), before WT cell injection (B_WT), post QTRT1-KO cell injection (P_KO), and post WT cell injection (P_WT) based on the Bray–Curtis dissimilarity analysis. n = 10 per group. (d) The principal coordinates analysis (PCoA) plot of the mouse feces was produced to inspect the homogeneity of multivariate dispersions. The samples collected before (B_WT and B_KO) and post (P_WT and P_KO) cell injection were colored in the illustration. n = 10 per group. (e) Relative bacterial abundance in species level (g_ indicate genus level; the unidentified species were named with super level and other ) of feces collected from nude mice before (B_WT and B_KO) and post (P_WT and P_KO) injection of wildtype (WT) and QTRT1-KO MCF7 cells was shown with the top 30 species, and lower ones were grouped as “Others”. Species were colored using the key in the list on the right side. Each bar represents individual mice (n = 10 each group).

