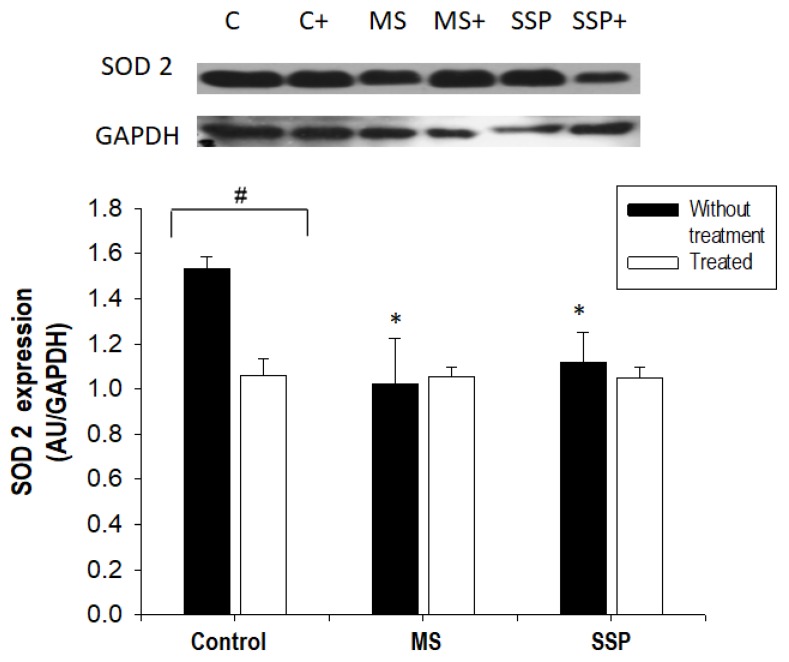
Figure 7.
The effects of the administration of RSV plus QSC on SOD 2 expression in the aorta homogenate. A representative Western blot image is shown. Data represent the mean ± SEM of five different rats from each group. # p < 0.01; * p < 0.05 against C group without treatment (after one-way ANOVA). Abbreviations: C = control; C+ = control treated with polyphenols; MS = metabolic syndrome; MS+ = metabolic syndrome treated with polyphenols; SSP = short sucrose period; SSP+ = short sucrose period treated with polyphenols.

