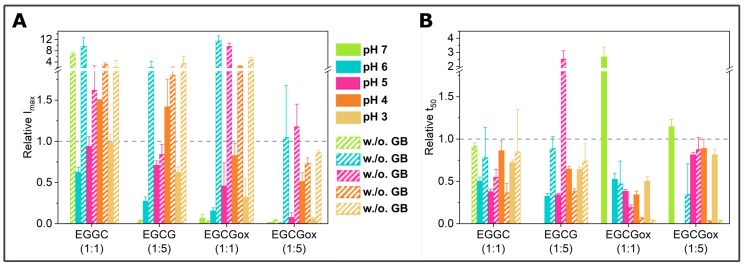
Figure 4.
Overview of the effects of EGCG and EGCGox on -synuclein aggregation monitored in a non-binding surface plate assayed by (A) maximum ThT fluorescence intensity and (B) t50 of the aggregation. Filled bars represent aggregation in the presence of glass beads and striped bars without glass beads. Error bars are standard deviations. The data are normalized to the control of the corresponding condition, and the comparison is outlined with the dashed line (at 1).

