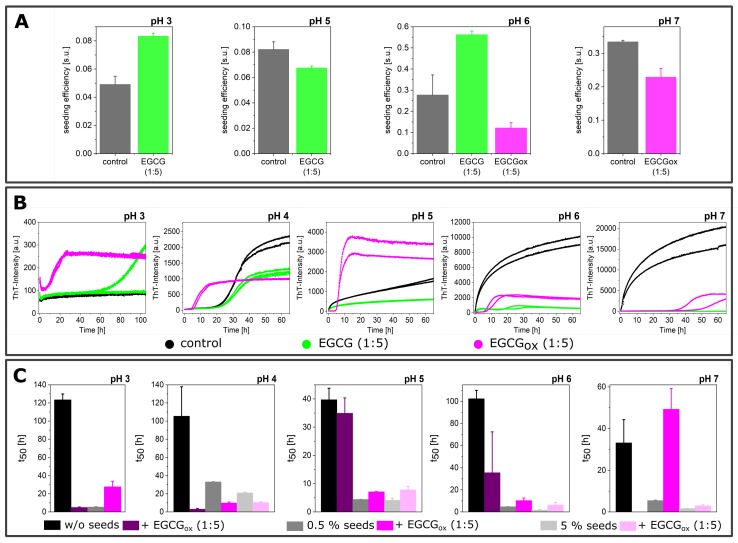
Figure 9.
(A) The seeding efficiency, expressed in seeding units (s.u., [49]), determined by fitting the kinetics of the 5% seeding experiments with y = 1 − e−kt after normalization between zero and one. Only the kinetics that showed the shape expected for a strongly seeded aggregation curve [49] were analyzed. (B) The effects of EGCG and EGCGox on the aggregation kinetics of -synuclein at different pH values (pH 3 to pH 7) in the presence of 0.5% seeds monitored in a non-binding surface plate under quiescent conditions. (C) The t50 of -synuclein at different pH values (pH 3 to pH 7) in a non-binding surface plate without additional seeds with shaking (black bar), with 0.5% seeds (dark grey bar) and 5% seeds (light grey bar) under quiescent conditions and in the presence of 1:5 EGCGox (violet).

