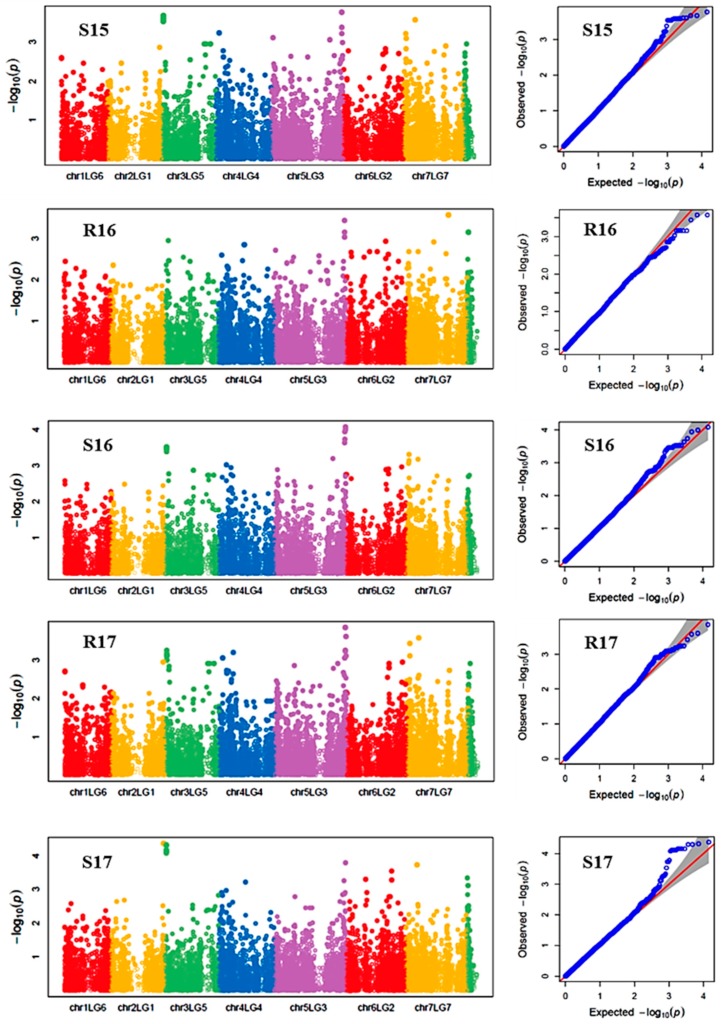
Figure 3.
Manhattan plots and the corresponding Q-Q plots representing the identification of SNP markers associated with reproductive stem length. The Manhattan plots are based on association of 15608 chromosomal and 1269 non-chromosomal SNPs with reproductive stem length of 135 pea accessions in the multi-year, multi-environment trials. Note: R16, Rosthern in 2016; R17, Rosthern in 2017; S15, Saskatoon in 2015; S16, Saskatoon in 2016; and S17, Saskatoon in 2017.

