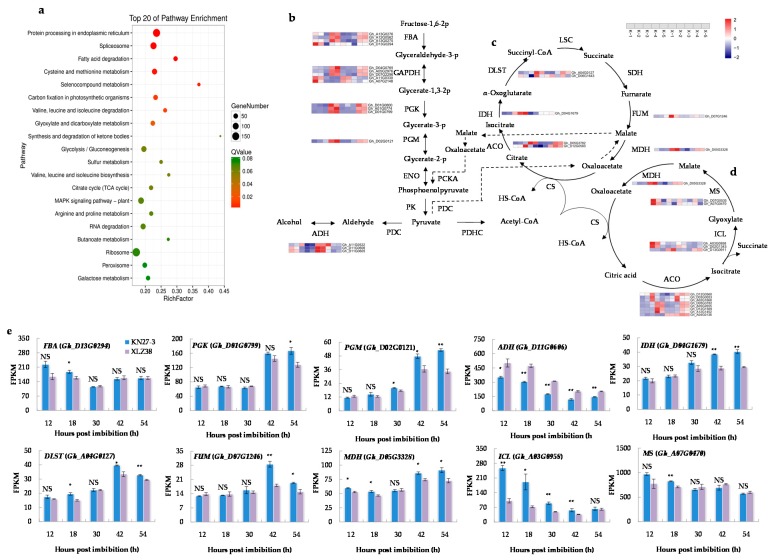
Figure 3.
Kyoto Encyclopedia of Genes and Genomes (KEGG) pathway enrichment analysis of DEGs. (a) The top 20 enriched pathways. The colors are shaded according to the Q-values level, as shown in the color bars gradually from low (red) to high (green); the size of the circle indicates the number of DEGs from small (less) to big (more); (b) glycolysis/gluconeogenesis pathways connected by black straight arrow line/black dashed arrow line and tricarboxylic acid (TCA) cycle (c) and glyoxylate cycle (GAC) metabolism (d) shown by the loop diagram. Relative levels of DEG expression are shown by a color gradient from low (blue) to high (red); (e) fragments per kilobase of transcripts per million mapped fragments (FPKM) of different major genes involved in the above metabolic pathways at different hours post imbibition. K, KN27-3. X, XLZ38. The numbers along the X-axis represent the sampling hours post imbibitions. The numbers in the scale bars indicate the log2 (fold changes) in gene expression. Bars marked with asterisks indicate differences change between the same hour (* p < 0.05, ** p < 0.01) according to Duncan’s multiple range test using SPSS software. “NS” represents no difference.

