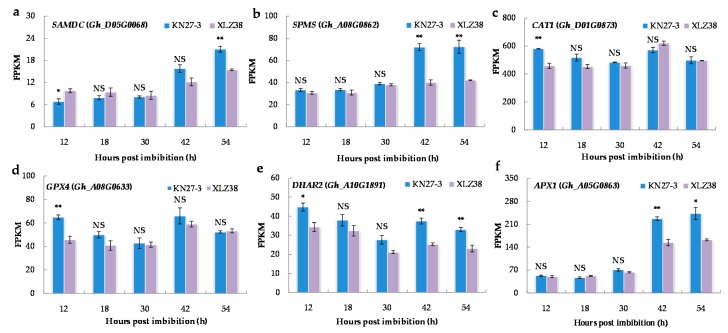
Figure 6.
The expression of DEGs related to spermine and polyamine biosynthetic process and antioxidant activity. (a) SAMDC, (b) SPMS, (c) CAT1, (d) GPX4, (e) DHAR2, (f) APX1. The Y axis shows the FPKM means of three independent replicates ± SE. Bars marked with asterisks indicate differences change between the same hour (* p < 0.05, ** p < 0.01) according to Duncan’s multiple range test using SPSS software. “NS” represents no difference.

