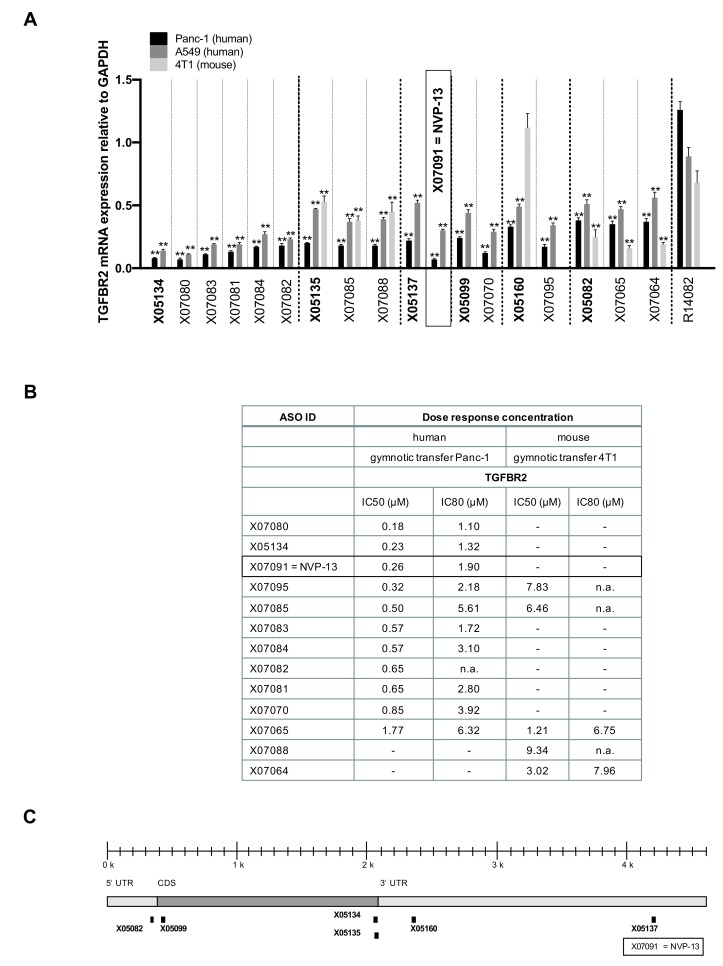
Figure 3.
Activity, potency, and binding sites of parental sequences and their derivatives. (A) Activity: Remaining TGFBR2 mRNA after 72 h of incubation with different antisense oligonucleotides as measured in a bDNA assay (n = 4) and compared to the reference gene GAPDH and normalized to respective PBS-treated cells. Panc-1 cells were treated with 5 µM, A549 and 4T1 cells with 7.5 µM of each ASO. Some derivatives were markedly more active than their parental sequences. Statistics was calculated by Ordinary-one-way-Anova followed by Dunnett’s multiple comparison test. ** p ≤ 0.01, ± = SEM. (B) Potency: Inhibitory concentrations (IC50 and IC80) of the most active candidates. Panc-1 (human) and 4T1 (mouse) cells were treated gymnotically for 72 h with 5 and 7.5 µM of each candidate. Remaining TGFBR2 mRNA was assessed in a bDNA assay (n = 4), and IC50 and IC80 were calculated. (C) Human TGFBR2 mRNA binding sites of parental sequences and their derivatives.

