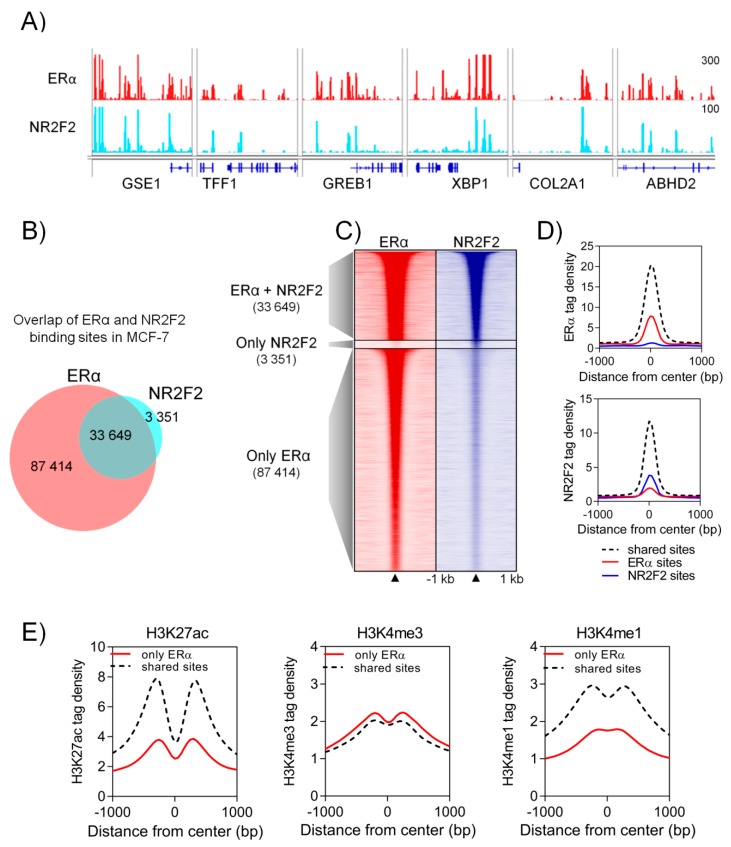
Figure 2.
NR2F2 at ERα binding events in MCF-7 cells. (A) The Integrative Genomics Viewer IGV screenshot shows ERα and NR2F2 binding sites at ERα target genes. (B) Proportional Venn diagram and (C) heatmap represent the overlapping regions between ERα and NR2F2 binding sites. (D) Histograms show the ERα and NR2F2 tag density at shared and individual binding sites. (E) Histograms show the H3K27ac, H3K4me3 and H3K4me1 tag density at shared and individual ERα binding sites.

