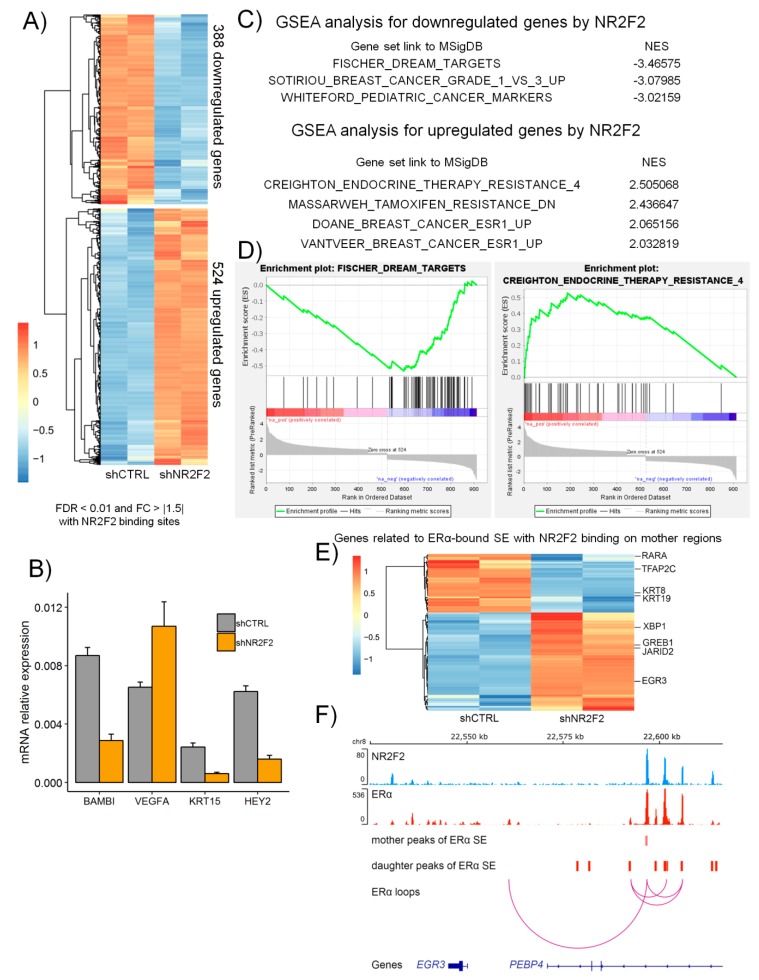
Figure 5.
NR2F2 regulated transcriptional programs in breast cancer cells with luminal A subtype. (A) RNA-seq heatmap shows the clusters of differentially expressed genes in NR2F2 silenced MCF-7 cells using specific shRNA (shNR2F2). (B) RT-qPCR validation shows specific differentially expressed genes in MCF-7 cells. (C) Gene set enrichment analysis (GSEA) shows the gene sets that were significantly enriched in NR2F2 silenced MCF-7 cells. NES, normalized enrichment score. (D) GSEA plots for specific gene sets. (E) RNA-seq heatmap shows the expression levels of genes related to ERα SE with NR2F2 binding on mother regions in control (shCTRL) and shNR2F2 treated MCF-7 cells. (F) IGV screenshot shows that NR2F2 and ERα binding sites marked the mother and daughter regions of ERα SE with ERα bound loops at the EGR3 gene.

