Figure 1.
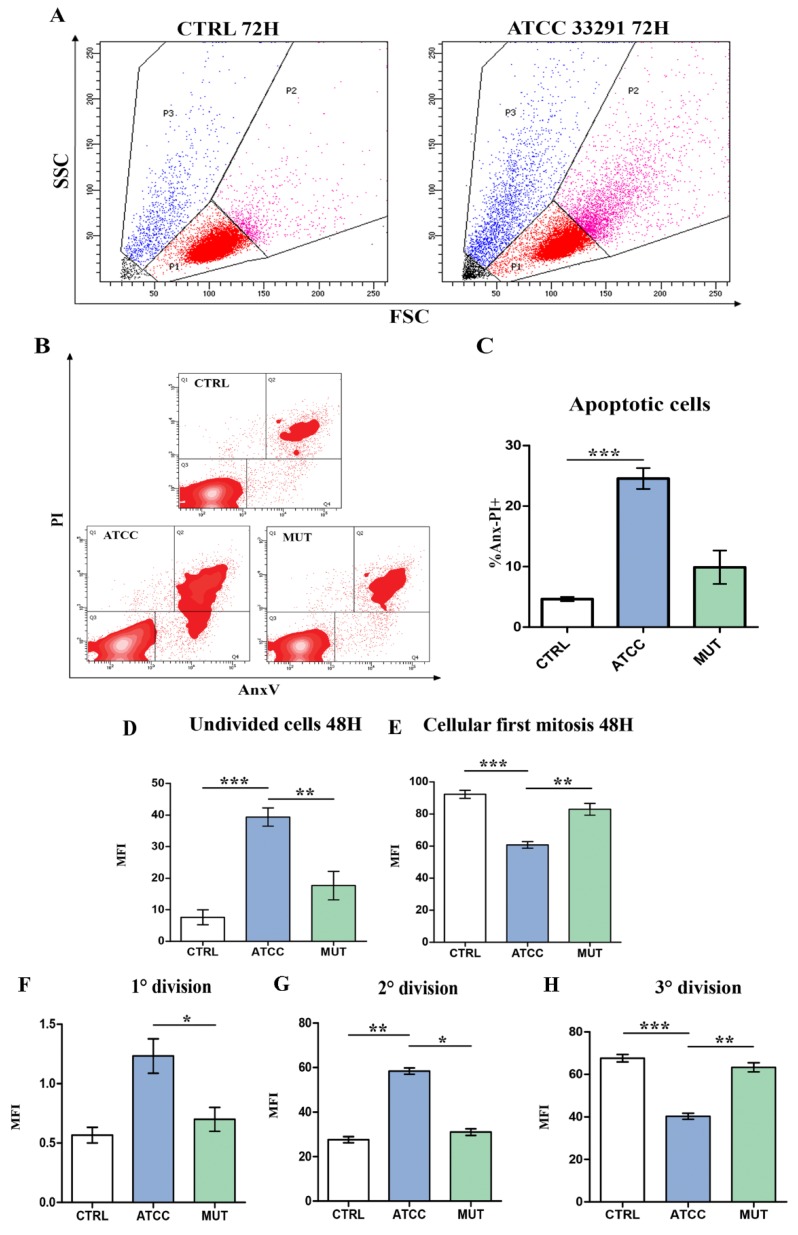
Evaluation of cell death induced by lysates and verification of the efficiency of the toxin, verified only in the ATCC33291-treated cells (A) U937 were split into different sub-populations depending on the morphologic parameters: blue gate shows dead cells, pink gate shows distended cells, and red gate shows viable cells. Total cells were the summary of red, pink, and blue gates. Black represents debris which were excluded for the analysis. Dot plots in the picture show control (CTRL) untreated cells and cells treated with the C. jejuni ATCC 33291 lysate for 72 h. (B) Density plot of propidium iodide (PI) vs. Annexin V (AnxV) of all experimental conditions. Q1 shows PI positive cells, Q4 shows AnxV positive cells, Q2 shows AnxV-PI positive cells, Q3 shows AnxV-PI negative cells and debris. (C) Statistical histograms of the percentage of AnxV-PI positive cells calculated after 72 h from lysate administration in total cells. Each value is expressed as a percentage ± SD (results from n ≥ 3 independent experiments). Asterisks denote a statistically significant difference (*** = p < 0.001) between strains. Statistical histograms related to CFSE dye dilution assay used to determine the number of divisions a given CFSE-labeled cell has undergone. (D) Statistical histogram of undivided cells calculated via CFSE staining at 48 h. (E) Statistical histogram of dividing cells calculated in cytometry via CFSE staining at 48 h. (F–H) Statistical histogram of cells in 1st, 2nd and 3rd division, at 72 h. Each value is expressed as a mean ± SD (results from n ≥ 3 independent experiments). Asterisks denote a statistically significant difference (* = p < 0.05, ** = p < 0.01, *** = p < 0.001) between strains.

