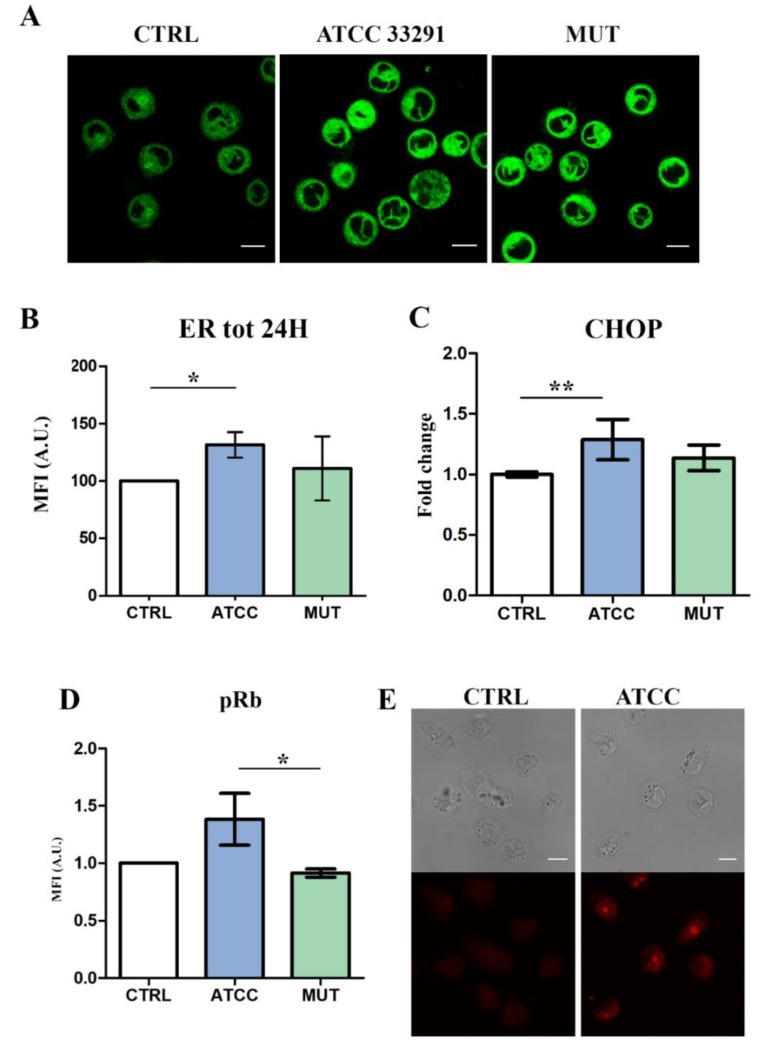
Figure 2.
Evaluation of ER involvement by confocal microscopy, flow cytometry, and RT-PCR analyses. (A) Single confocal optical sections of ER Tracker MFI of untreated cells and treated U937 at 24 h. Bars: 10 µM. (B) Statistical histograms of ER Tracker MFI at 24 h, quantitated by flow cytometry. Each value was converted to arbitrary units (A.U.), setting the control as 100. Each value is expressed as a mean ± SD (results from n ≥ 3 independent experiments). (C) Evaluation of C/EBP-homologous protein (CHOP) expression in U937 cells after 24 h from lysate administration. Welch’s unpaired t test revealed: ** p = 0.009 for CTRL vs. ATCC 33291. Evidence of pRb modulation by flow cytometry and confocal microscopy. (D) Statistical histograms of pRb intracellular content in U937 cells at 72 h. Each value was converted to arbitrary units (A.U.), setting the control as 1. Each value was expressed as a mean ± SD (results from n ≥ 3 independent experiments). The asterisk denotes a statistically significant difference (* = p < 0.05) between strains. (E) Single confocal optical sections of pRb MFI of untreated cells and U937 cells preincubated with the C. jejuni ATCC 33291 lysate for 72 h. Bars: 10 µM.

