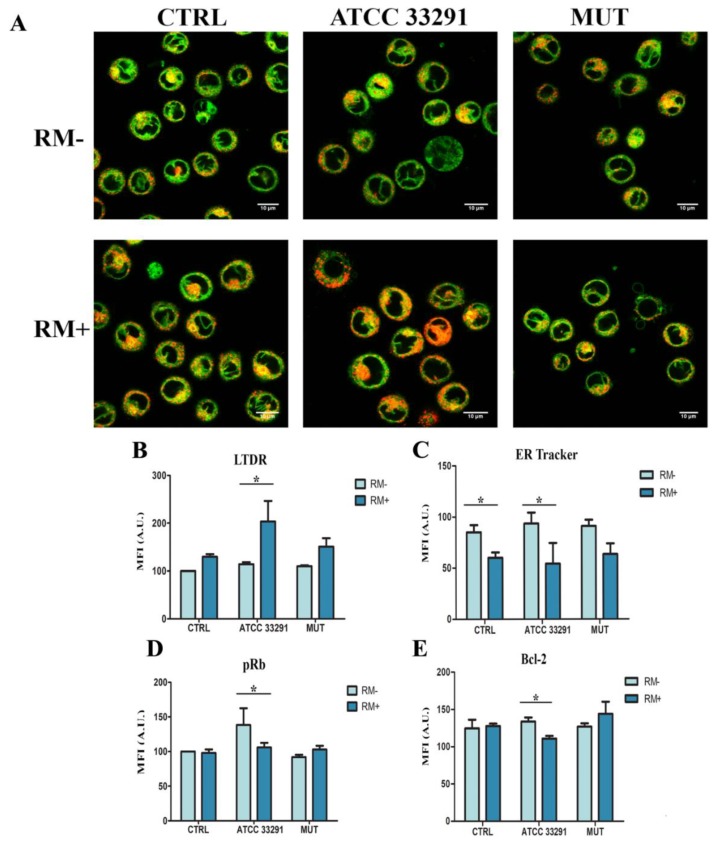
Figure 4.
Concomitant evaluation of ER tracker and LysoTracker Deep Red (LTDR) fluorescence by qualitative analysis (confo) (A) Single confocal optical sections of ER Tracker (in green) and LTDR (in red) of untreated U937 cells (CTRL) and U937 cells preincubated with lysates after 72 h of treatment with and without RM. Where present, co-localization is shown in yellow-orange. Lower pictures show U937 cells pre-treated with RM for 2 h before lysate administration. Bars: 10 µM. Contemporaneous evaluation of ER tracker and LTDR fluorescence by quantitative analysis (flow cytometry). (B,C) For investigated parameters, ER (by ER Tracker staining) and lysosomes (by LTDR staining), a comparison between RM- and RM+ values was carried out for each experimental condition at 72 h. The pRb and bcl-2 expression modulated by lysates (light blue) and lysates + RM (dark blue). (D) Statistical histograms of MFI of pRb were calculated after 72 h from lysate administration in distended cells with and without RM. Each value was converted to arbitrary units (A.U.), setting the control as 100. (E) Statistical histograms of MFI of bcl-2 was calculated after 72 h from lysate administration in distended cells with and without RM. Each value is expressed as a mean ± SD (results from n ≥ 3 independent experiments). Asterisks denote a statistically significant difference (* = p < 0.05) between strains.

