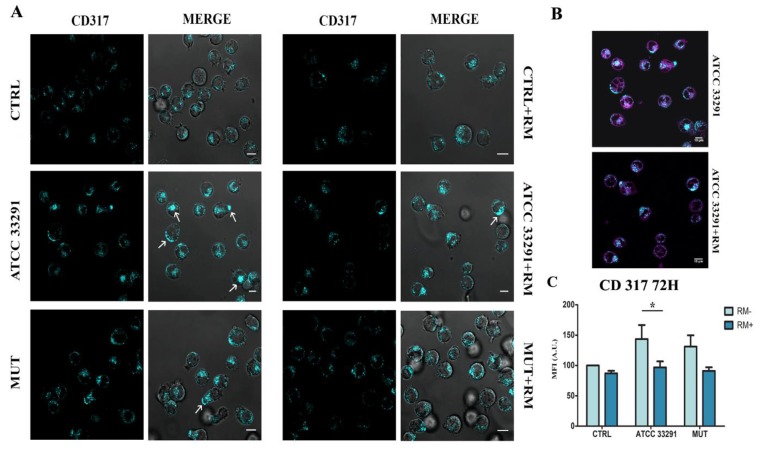
Figure 6.
Expression of CD317/tetherin: localization and quantitation by confocal and cytometric analyses, respectively. (A) Single confocal optical sections of CD317 of untreated U937 cells (CTRL) and U937 cells after 72 h of treatment by lysates, with and without RM. Bars: 10 µM. (B) A comparison between RM- and RM+ ATCC33291 lysate (CDT active)-treated cells: magenta stain represents ER-tracker fluorescence, added to better visualize CD317 distribution and to resemble the ER decrease induced by RM. Bars: 10 µM (C) Statistical histograms of CD317 MFI were calculated after 72 h from lysate administration in cells with and without RM. Each value was converted to arbitrary units (A.U.), setting the control as 100. Each value is expressed as a mean ± SD (results from n ≥ 3 independent experiments). Asterisks denote a statistically significant difference (* = p < 0.05) between strains.

