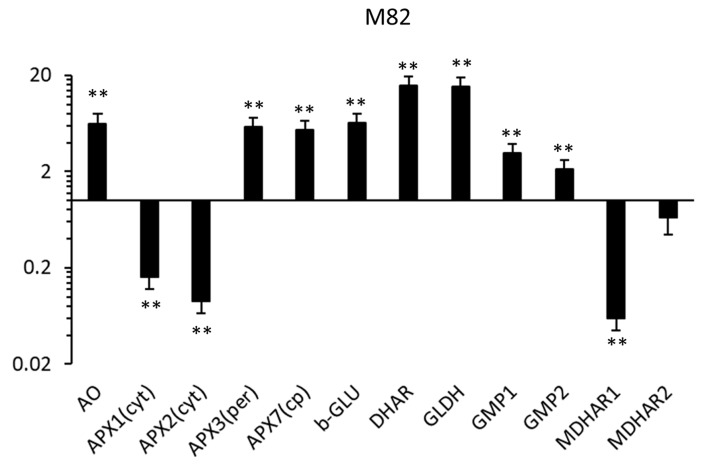
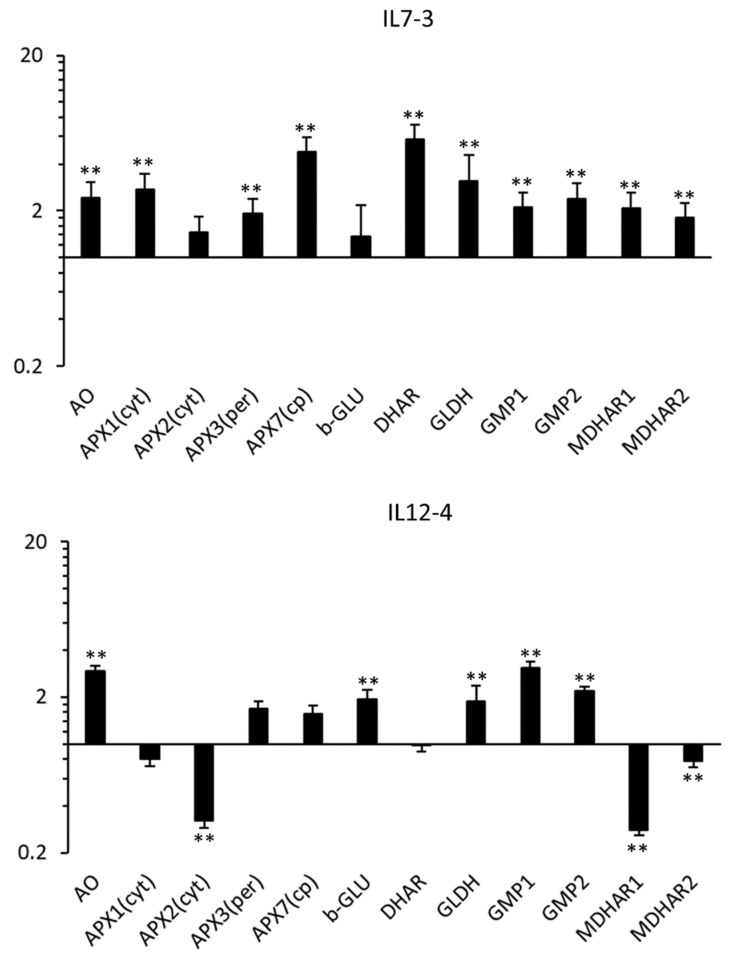
Figure 6.
Relative gene expression by real-time PCR of genes involved in AsA biosynthesis. For each genotype (M82, IL7-3 and IL12-4), quantities (RQ) are relative to the calibrator condition (fruit explant) and are graphed on a logarithmic scale. For each gene, asterisks indicate that the 2−ΔCt values were significantly different between the test (calli at 60 days) and calibrator condition (** p < 0.01; t-test).


