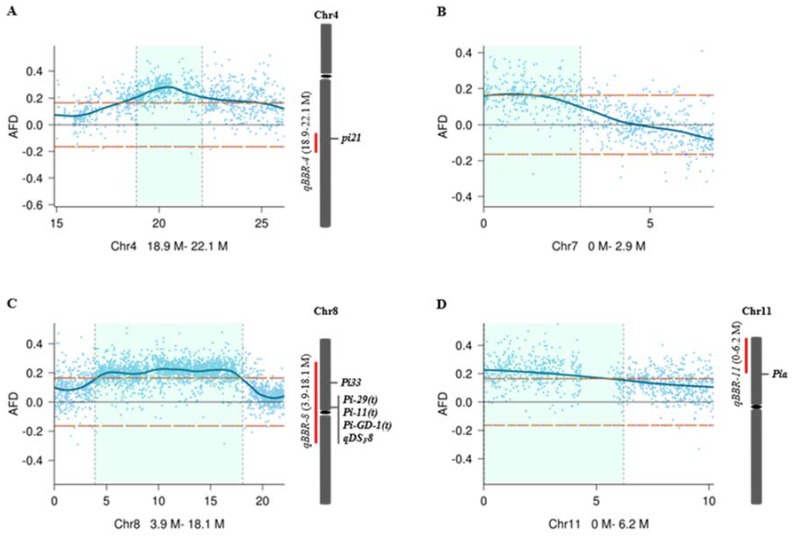
Figure 3.
Estimates of confidence intervals of the four QTLs, qBBR-4 (A), qBBR-7 (B), qBBR-8 (C), and qBBR-11 (D). The horizontal orange dashed lines indicate the threshold (0.165) at the overall significance level of p < 0.05. The light green areas indicate 95% confidence intervals of the QTLs. Previously reported R genes or QTLs within or closely near the confidence intervals of qBBR-4, qBBR-8, and qBBR-11 are indicated on the right. AFD: allele frequency difference.

