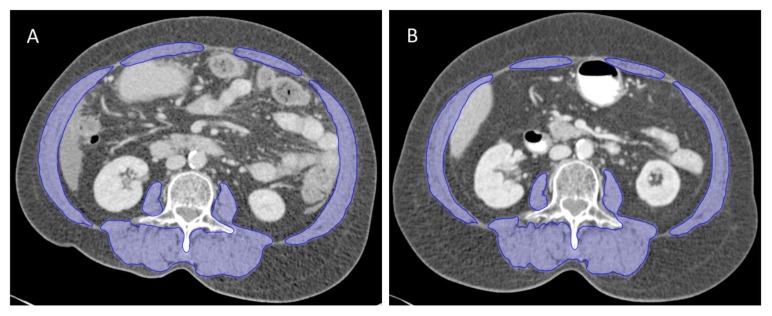
Figure 1.
The change of skeletal muscle area (outlined in blue) on computed tomography (CT) images at the L3 vertebral level at the baseline (A) and after chemoradiation therapy (B) from one patient. Images were taken 5 months apart. At the time point of pre-treatment CT, the body mass index (BMI) and skeletal muscle index (SMI) were 24.1 kg/m2 and 51.8 cm2/m2, respectively. At the time point of post-treatment CT, the BMI and SMI were 25.4 kg/m2 and 47.3 cm2/m2, respectively.

