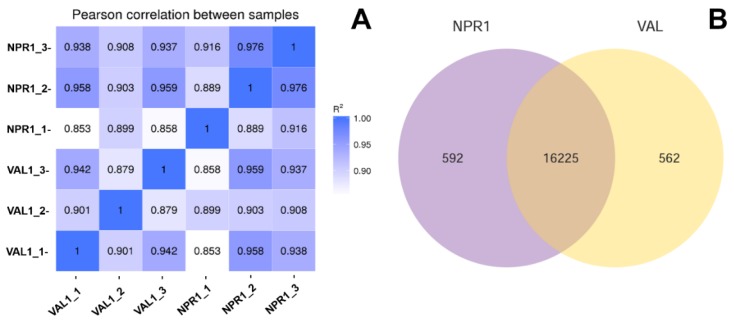
Figure 1.
RNAseq analysis (A) Correlation between RNA-Seq samples. NPR1_1/2/3 represent three replicates of the NPR1 overexpressing line (NPR1-2), Val_1/2/3 represent three replicates of the control non-transgenic ‘Valencia’ line, heat maps of the correlation coefficient between samples, R2 means the square of the Pearson coefficient; (B) Venn diagram of expressed genes in transgenic NPR1 overexpressing line (NPR1-2) and control non-transgenic ‘Valencia’ line. FPKM > 1 is the expression threshold, NPR1 and Val represent the AtNPR1-transgenic line (NPR1-2) and non-transgenic ‘Valencia’ line, respectively.

