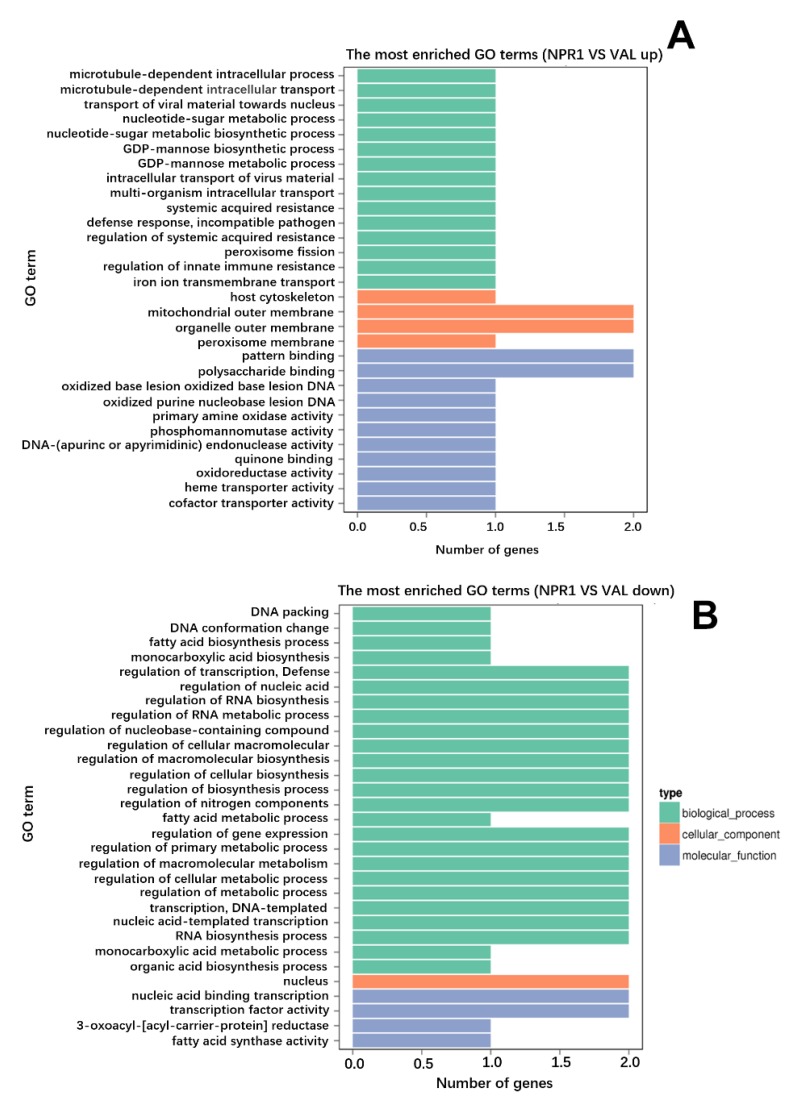
Figure 3.
Gene ontology (GO) term enrichment analysis. (A,B) The GO enrichment terms of (A) upregulated (B) and downregulated DEGs. In the x-axis the number of DEGs is represented, and in the y-axis the GO terms enriched. Different colors are used to distinct biological process, cellular components, and molecular function.

