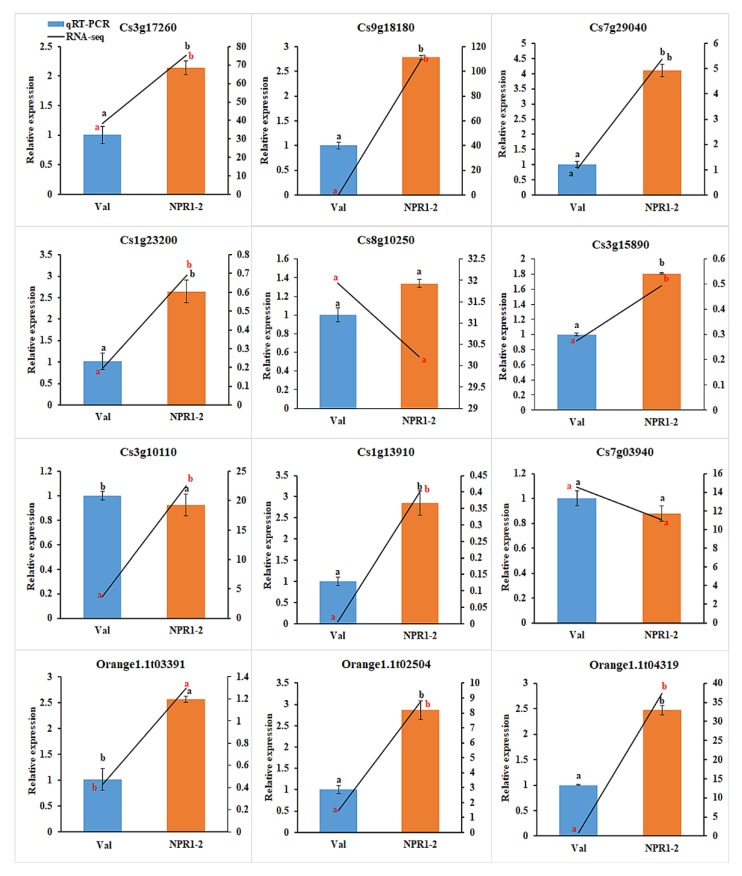
Figure 4.
qRT-PCR verification for expression pattern of selected DEGs. The expression levels of DEG candidates in NPR1-2 transgenic line compared to Val control determined by qRT-PCR (2-ΔΔCt). Different letters (a, b) represent a significant difference at p ≤ 0.05 using Duncan’s Multiple Range Test and error bars represent SE (n = 3).

