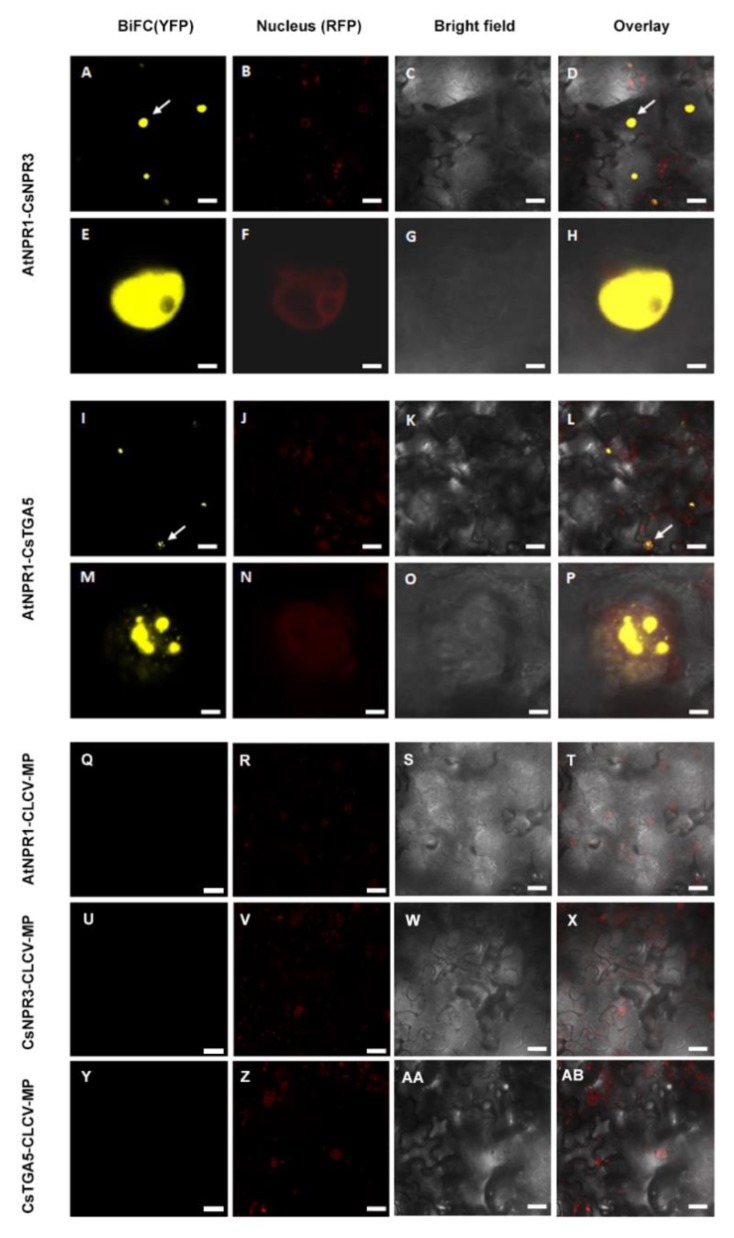
Figure 7.
Confocal micrographs showing results of bimolecular fluorescence complementation assays (BiFC) assays to determine interactions between AtNPR1 with CsNPR3 and CsTGA5 proteins. (A–AB) show micrographs of YFP (BiFC), nuclear marker (Nucleus), transmission white light (Bright field) and the resultant overlay, respectively. The upper set of panels are showing positive interaction and the bottom set of pictures are showing the negative controls. (A–H) show the AtNPR1 and CsNPR3 positive interaction. (E–H) is a zoom up containing nuclei details. In (I–P) the positive interaction between AtNPR1 and CsTGA5 is demonstrated and (M–P) is a zoom up showing nuclei. White arrows indicate nuclear interaction. (Q–AB) pictures show the negative controls. All the constructs were transiently co-expressed in Nicotiana benthamiana RFP-H-2B plants. The scale bars represent 35 µM in length and for the magnified images each bar represent 5 µM in length.

