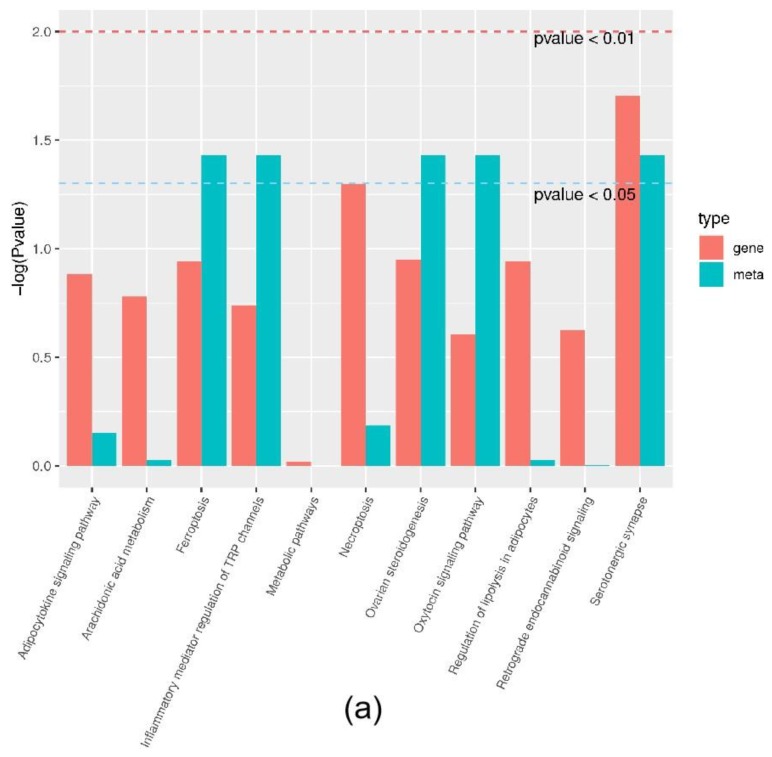
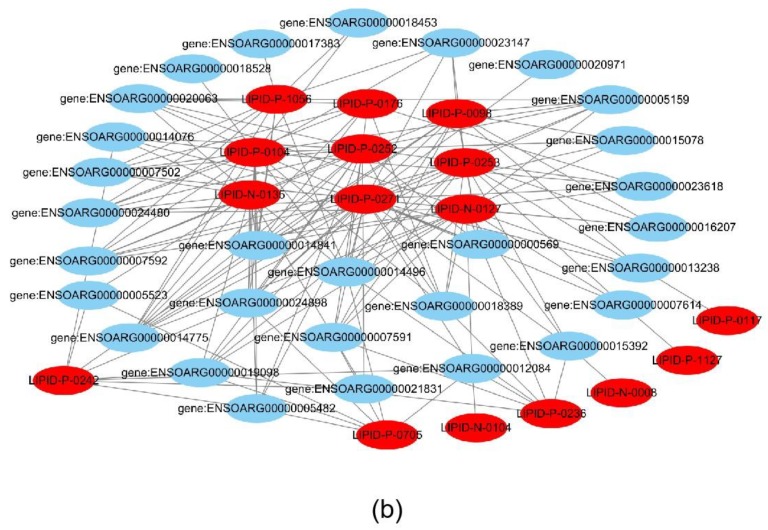
Figure 4.
Joint analysis results: (a) the classification histogram of pathways in which differentially expressed genes and differential metabolites were enriched in KEGG analysis; (b) correlation network diagram of differentially expressed genes and differential metabolites. Red: differential metabolites; Blue: differentially expressed genes.


