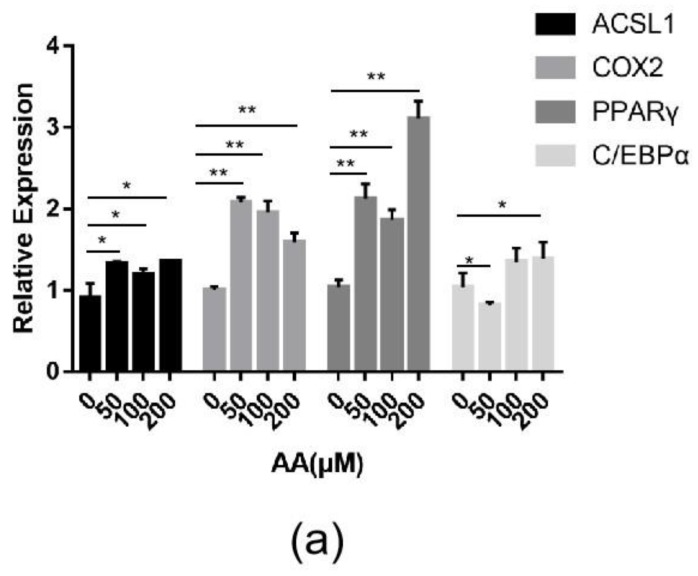
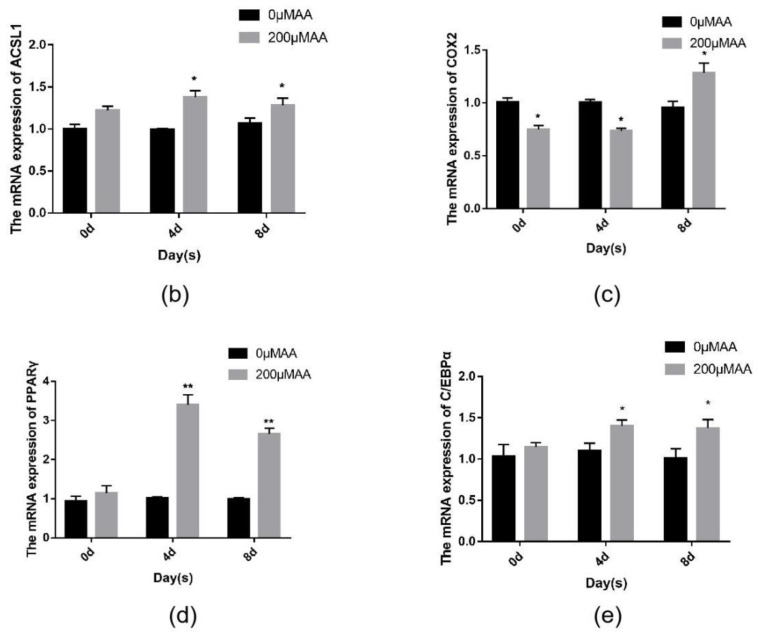
Figure 9.
(a) ACSL1, COX2, PPARγ, and C/EBPα mRNA expression levels in sheep adipocytes with different concentrations (50, 100, and 200 μΜ) of AA on the 9th day of differentiation; (b–e) ACSL1, COX2, PPARγ and C/EBPα mRNA expression levels in sheep adipocytes during different stages of differentiation (* p < 0.05, ** p < 0.01).


