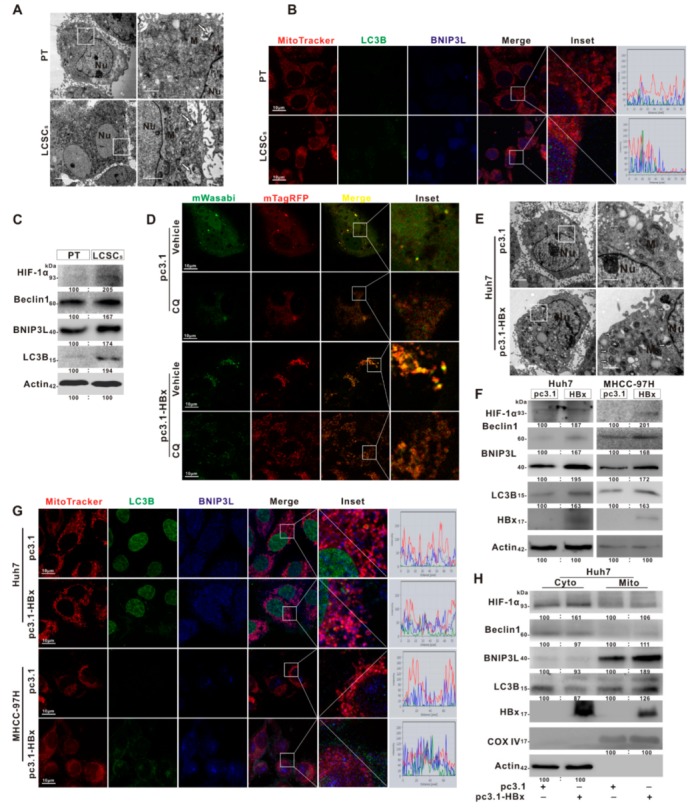
Figure 5.

BNIP3L-dependent mitophagy was induced in HBx-expressing HCC cells and LCSCs. (A–C) LCSCs were enriched in Huh7 cells by sphere-formation assay, and normally cultured Huh7 cells served as the parental cells (PT) control group. (A) Mitochondrial ultrastructures were analyzed by TEM. (B) Representative images of the immunofluorescence co-staining for MitoTracker (red), BNIP3L (blue), and LC3B (green). Scale bar represents 10 μm. (C) The expression levels of BNIP3L-dependent mitophagy-related proteins. (D–H) Huh7 and MHCC-97H cells without or with HBx-expressing were transiently transfected with pcDNA3.1 or pcDNA3.1-HBx (1 μg/mL). (D) Representative fluorescent images of Huh7 and HBx-expressing Huh7 cells were transiently transfected with mTagRFP-mWasabi-LC3 with the pretreatment of chloroquine (CQ, 20 μg/mL) or not. (E) Mitochondrial ultrastructures in Huh7 and HBx-expressing Huh7 cells were analyzed by TEM. Scale bar represents 2 μm (Left) or 1 μm (Right). (F) The protein expression of BNIP3L-dependent mitophagy in HCC cells and their HBx-expressing cells. (G) Representative images of the immunofluorescence co-staining for MitoTracker (red), BNIP3L (blue), and LC3B (green) in HCC cells with or without HBx-expressing. The profiles of representative lines trace the intensities of fluorescence signals. Fluorescence curves with line intensity profile generated by Zen 2012 software were shown. (H) The protein expression of BNIP3L-dependent mitophagy in cytoplasmic (Cyto) and mitochondrial (Mito) fractions of Huh7 cells and its HBx-expressing cells. The gray value of band was assessed by image-pro plus 6.0. The relative expression level was shown. pc3.1: pcDNA3.1 transfection without HBx-expressing. pc3.1-HBx: pcDNA3.1-HBx transfection with HBx-expressing.
