Figure 3.
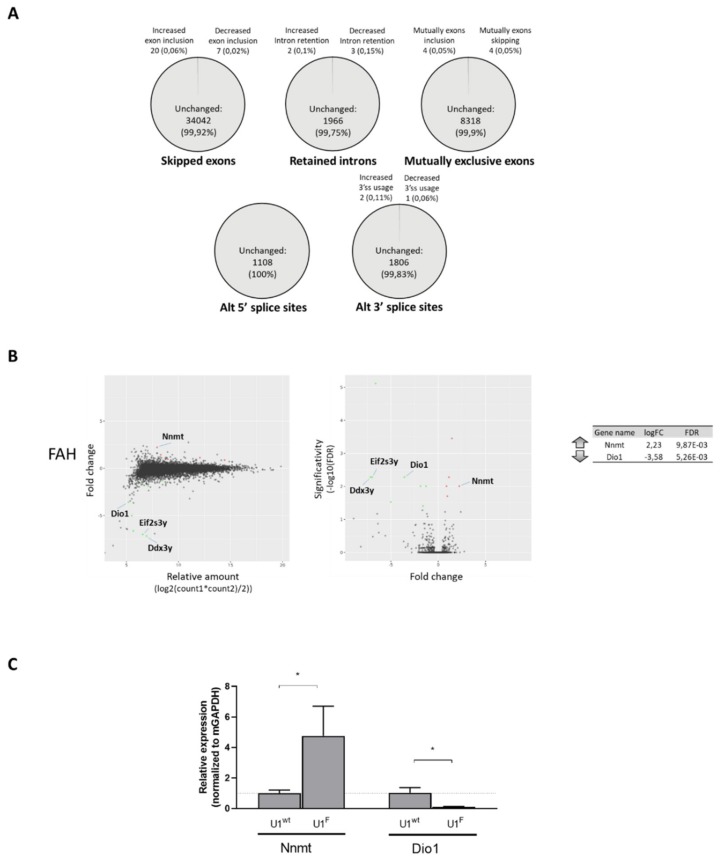
The compensatory U1F does not have a widespread effect on splicing and overall gene expression. (A) Fraction of each category (SE, RI, MXE, A5SS and A3SS) of Gencode-annotated splicing events showing increased or decreased alternative isoform use in hepatocytes from FAH5961SB mice treated with AAV8-U1F as compared with those treated with AAV8-U1wt. For each category, the number and the percentage (%) of events is indicated in the graph (FDR ≤0.05; Inclusion Level Difference ≤−0.2 or ≥0.2). (B) Comparison of the gene expression profile in hepatocytes from FAH5961SB mice injected with AAV8-U1F as compared with those injected with the control AAV8-U1wt. Only genes coding for proteins and having a fold change higher than two are shown. MA plot showing the relationship between the average expression value (on the X-axis) and the fold change (Y-axis) for each gene in the genome (left panel). Volcano plot showing the relationship between the fold-change (on the X-axis) and the significance of the differential expression test (Y-axis) for each gene (middle panel). Black dots represent the genes that are not significantly differentially expressed, while red and green dots represent the genes significantly UP- and DOWN-regulated, respectively. List of coding genes UP and Down regulated and mapping in autosomes (right panel). Only genes having a fold-change (FC) >2 were reported. Adjusted p-values for multiple tests (by the Benjamini–Hochberg procedure) are reported as “false discovery rate” (FDR) value. (C) Validation of RNAseq data by qPCR. Histograms report the relative gene expression ± standard deviation (SD) from three independent experiments, normalized for the house keeping mouse GAPDH.

