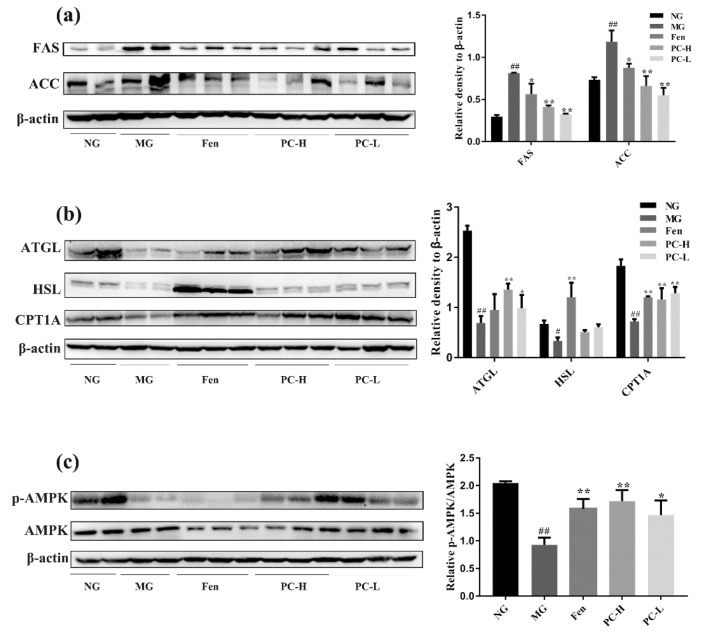
Figure 4.
Effects of proanthocyanidins on expression of lipid metabolism-associated proteins. (a) Western blot analysis of FAS and ACC in T2DM mice. (b) Western blot analysis of ATGL, HSL, and CPT1A in T2DM mice. (c) Western blot analysis of p-AMPK and AMPK in T2DM mice. NG, normal diet group; MG, HFD/STZ- induced T2DM; Fen, HFD/STZ-induced T2DM + 250 mg/kg fenofibrate; PC-H, HFD/STZ-induced T2DM + 200 mg/kg proanthocyanidins; PC-L, HFD/STZ-induced T2DM + 50 mg/kg proanthocyanidins. Values are expressed as Mean ± SD, with 9 mice in each group. # p < 0.05 and ## p < 0.01 compared with the NG group; * p < 0.05 and ** p < 0.01 compared with the MG group.

