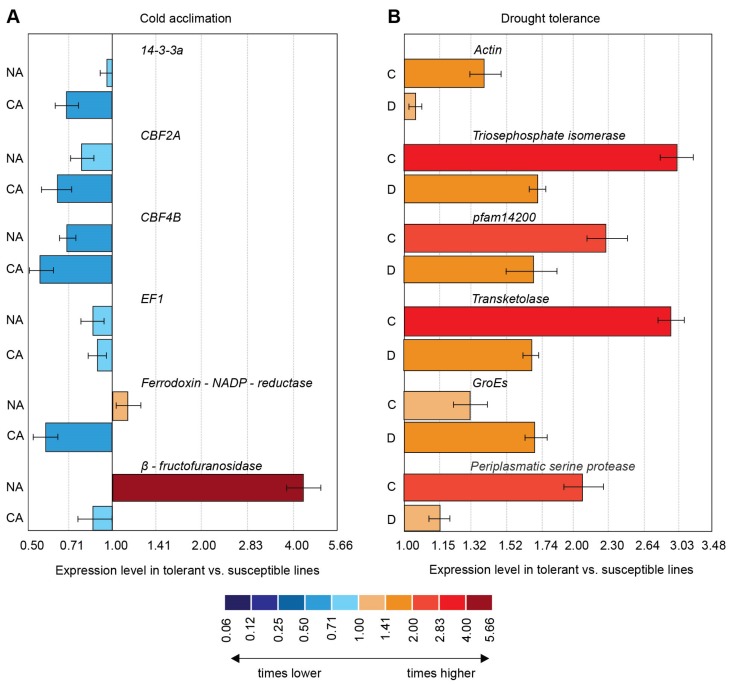
Figure 2.
(A) Relative expression of genes before (NA) and after cold acclimation (CA) in freezing-tolerant (mean for DH602 and DH534) vs. freezing-susceptible (mean for DH158 and DH575) lines. (B) Relative expression of genes in well-watered plants (C) and under drought (D) in drought-tolerant (mean for DH561 and DH534) vs. susceptible (mean for DH435 and DH602) lines. Error bars represent standard error between the means of two lines (each with three biological replicates and three instrumental repetitions).

