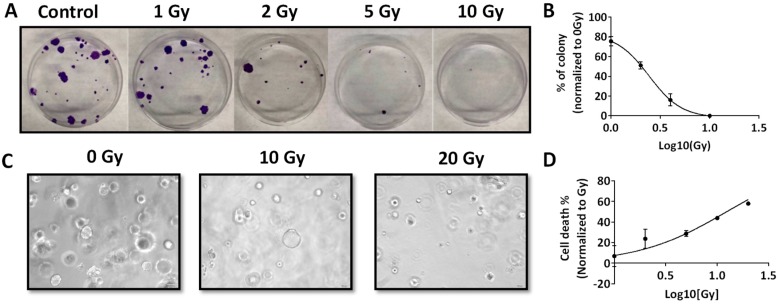
Figure 2.
Radiation response of RP-MOC1 in 2D culture and 3D organoids. (A) Digital photographs of crystal violet stained RP-MOC1 cells on day 15 post radiation compared control. Radiation dose response curves of RP-MOC1 cells in 2D (B) RP-MOC1 organoids (C). Bright field microscopy images (D) of RP-MOC1 organoids showing a reduction in size post radiation. Data are expressed as mean ± SEM. Image was acquired at 20× magnification.

