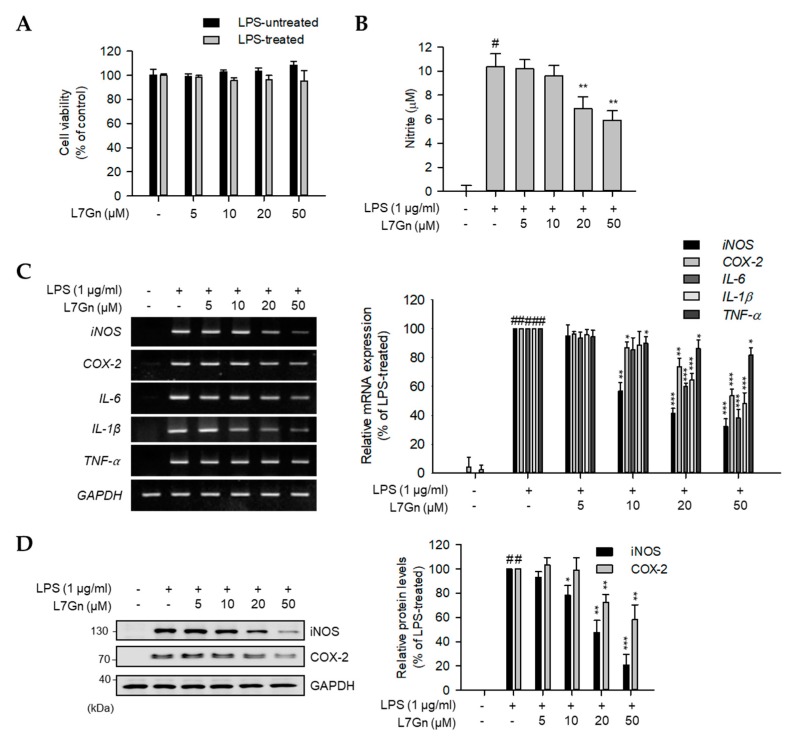
Figure 2.
Inhibitory effects of L7Gn on the production of proinflammatory mediators. (A and B) RAW 264.7 macrophages were pre-treated with various concentrations of L7Gn (0, 5, 10, 20, and 50 μM) for 2 h, and incubated in the presence or absence of lipopolysaccharide (LPS) (1 μg/mL) for an additional 24 h. (A) Cell viability was examined using EZ-Cytox assay solution and results were expressed relative to those for the untreated control group. Data represent the mean ± standard deviation (S.D.). (B) Nitric oxide (NO) secretion levels in culture media measured using Griess reagent. NO levels were calculated according to a standard curve plotted using a nitrite standard solution. Data represent the mean ± S.D. (C and D) RAW 264.7 cells were pre-treated with L7Gn (0, 5, 10, 20, and 50 μM) for 2 h and then incubated with LPS (1 µg/mL) for indicated times (3 h for RT-PCR and 24 h for immunoblotting analyses). (C) Total RNA was extracted and reverse transcribed to cDNA. Inducible NO synthase (iNOS), cyclooxygenase-2 (COX-2), and pro-inflammatory cytokines were amplified by PCR and detected on agarose gel. The representative data are shown. (D) Total cell lysates were prepared and immunoblot analysis was performed. The protein expression of iNOS and COX-2 was detected using an ECL system and quantified using the LabWorks software. Expression levels of iNOS and COX-2 proteins were normalized to that of GAPDH. Relative expression levels of iNOS and COX-2 are represented as a bar graph (lower panel). Data represent the mean ± S.D. # p < 0.01 relative to the LPS-treated and L7Gn-untreated control group. * p < 0.05, ** p < 0.01, and *** p < 0.001 relative to the LPS-treated and 5 μM L7Gn-treated group.

