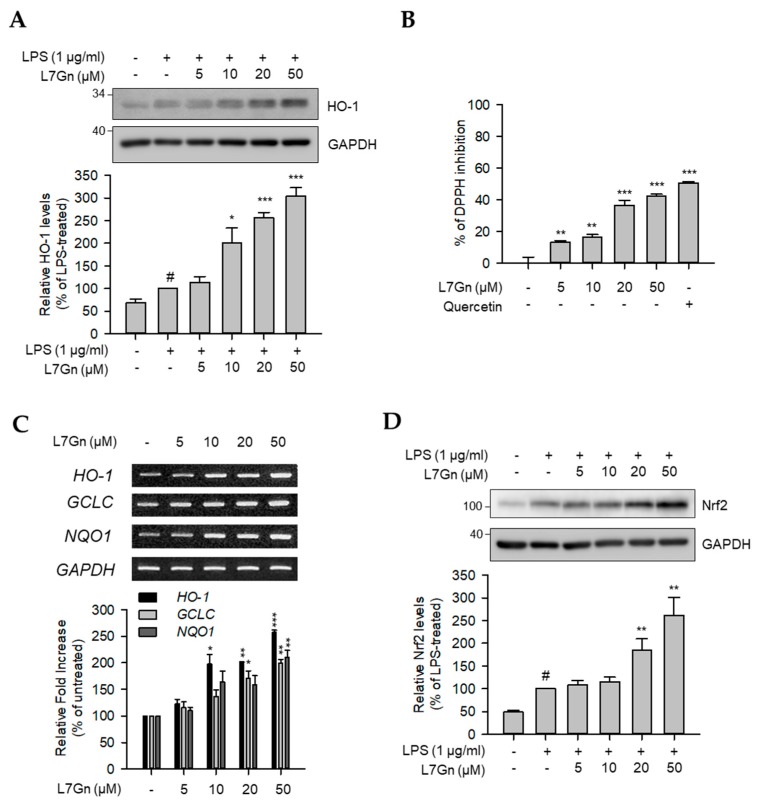
Figure 5.
Effects of L7Gn on anti-oxidative regulators. RAW 264.7 cells were pre-treated with L7Gn for 2 h and then treated with LPS (1 μg/mL) for 24 h for immunoblot analyses. (A) Total cell lysates were prepared and immunoblot analysis was performed. The expression of HO-1 was detected using specific antibodies. Expression levels of HO-1 were normalized to GAPDH levels. Results of the quantitative analyses of protein levels after normalization are shown (lower panel). Data represent the mean ± S.D. # p < 0.01 relative to the LPS-untreated control group. * p < 0.05 and *** p < 0.001 relative to the LPS-treated and 5 μM L7Gn-treated group. (B) DPPH free radical scavenging activity was represented as the mean ± S.D. ** p < 0.01 and *** p < 0.001 relative to the non-treated group. (C) Total RNA was extracted and reverse transcribed to cDNA. HO-1, GLCL, and NQO1 were amplified by PCR and detected on agarose gel. The representative data are shown. * p < 0.05, ** p < 0.01, and *** p < 0.001 relative to the untreated group. (D) Total cell lysates were prepared and immunoblot analysis was performed. The expression of Nrf2 was detected using specific antibodies. Expression levels of Nrf2 were normalized to GAPDH levels. Results of the quantitative analyses of protein levels after normalization are shown (lower panel). Data represent the mean ± S.D. # p < 0.01 relative to the LPS-untreated control group. * p < 0.05 and ** p < 0.01 relative to the LPS-treated and 5 μM L7Gn-treated group.

