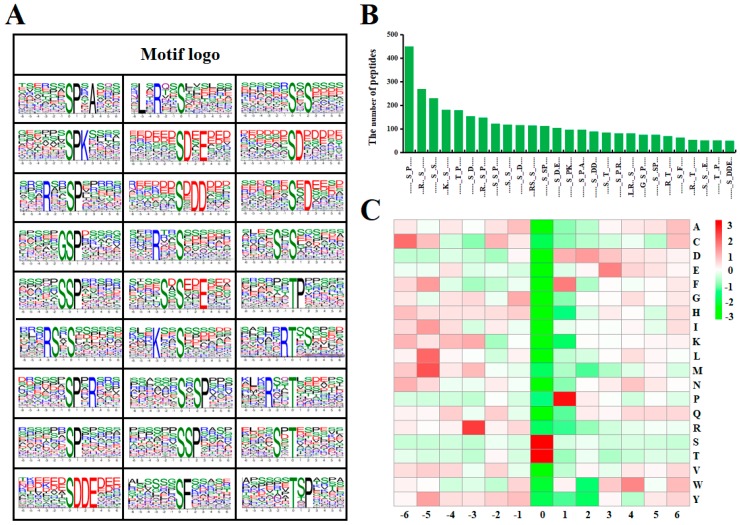
Figure 3.
Analysis of phosphorylation sites. (A) Sequence motif analysis of phosphorylation sites. (B) The number of identified peptides containing phosphorylation sites in each motif. (C) The relative abundance of amino acid residues flanking the phosphorylation sites represented by an intensity map. The intensity map shows the relative abundance for six amino acids from the phosphorylation site. The colors in the intensity map represent the log10 of the ratio of frequencies (red shows enrichment, green shows depletion).

