Figure 7.

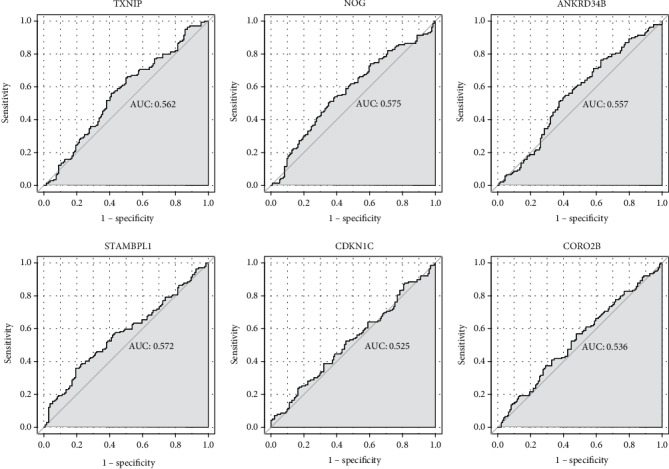
The ROC curves of TXNIP, NOG, ANKRD34B, STAMBPL1, CDKN1C, and CORO2B in AD. The ROC curves were used to show the diagnostic ability with 1-specificity and sensitivity.

The ROC curves of TXNIP, NOG, ANKRD34B, STAMBPL1, CDKN1C, and CORO2B in AD. The ROC curves were used to show the diagnostic ability with 1-specificity and sensitivity.