Figure 1.
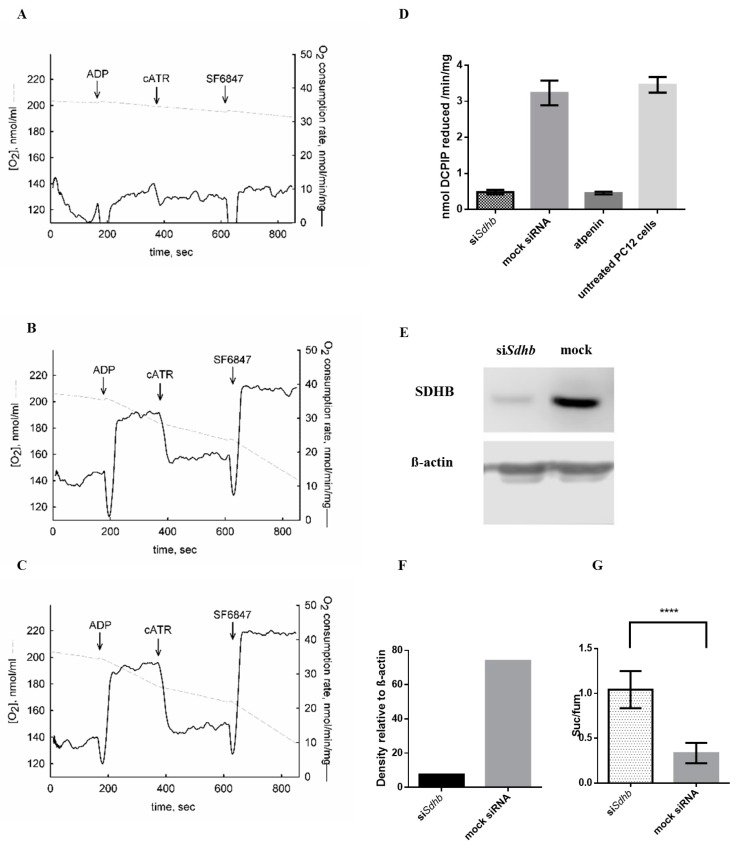
Effects of Sdhb knockdown in PC12 cells. (A–C) Oxygen consumption PC12 cells. Grey trace represents the negative time derivative of oxygen concentration, divided by mitochondrial mass per volume. Additions of substances are indicated by arrows. ADP: 0.2 mM. cATR: 2 µM. SF 6847: 1 µM. (A) Respiration of siSdhb transfected PC12 cells. (B) Respiration of mock transfected PC12 cells. (C) Respiration of untreated PC12 cells. (D) Succinate dehydrogenase (SDH) activity after siSdhb transfection, mock siRNA transfection, atpenin treatment and in untreated PC12 cells. The effectiveness of siSdhb transfection was compared to atpenin, which is a well-known potent SDH inhibitor. (E) SDHB protein level after siRNA transfection using Western blot analysis. (F) Densitometry quantification of the SDHB protein in siRNA against Sdhb treated and mock siRNA transfected PC12 cells. (G) Succinate to fumarate ratio in PC12 cells transfected with SDHB targeting siRNA (siSdhb) compared to mock transfected cells. suc/fum: succinate to fumarate ratio. ****: p < 0.0001.

