Figure 2.
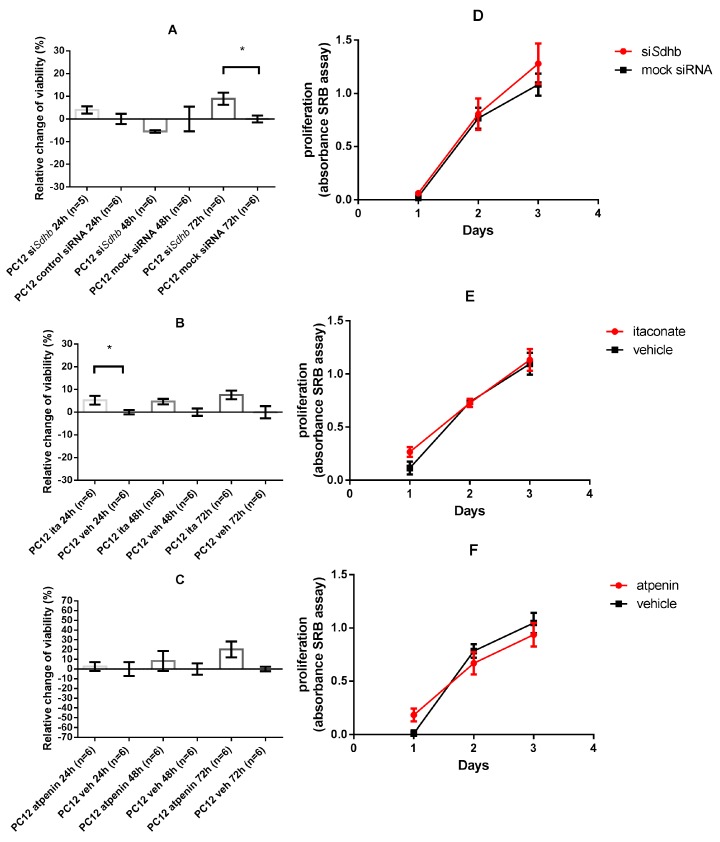
Cell viability and proliferation of PC12 cell lines. Data is presented in mean ± SEM. Cell viability measurement values are normalized to the control values. A total of 100% was subtracted from the values, therefore, changes in % compared to control are presented. (A–C) Relative change of cell viability of Sdhb targeting siRNA transfected, itaconate, or atpenin treated PC12 cells after 24, 48, and 72 h incubation, compared to control. (D–F) Proliferation of PC12 cells after Sdhb targeting siRNA transfection, itaconate, or atpenin treatment measured by SRB assay. Ita: Itaconate; veh: vehicle. SRB: Sulforhodamine B; *: p < 0.05.

