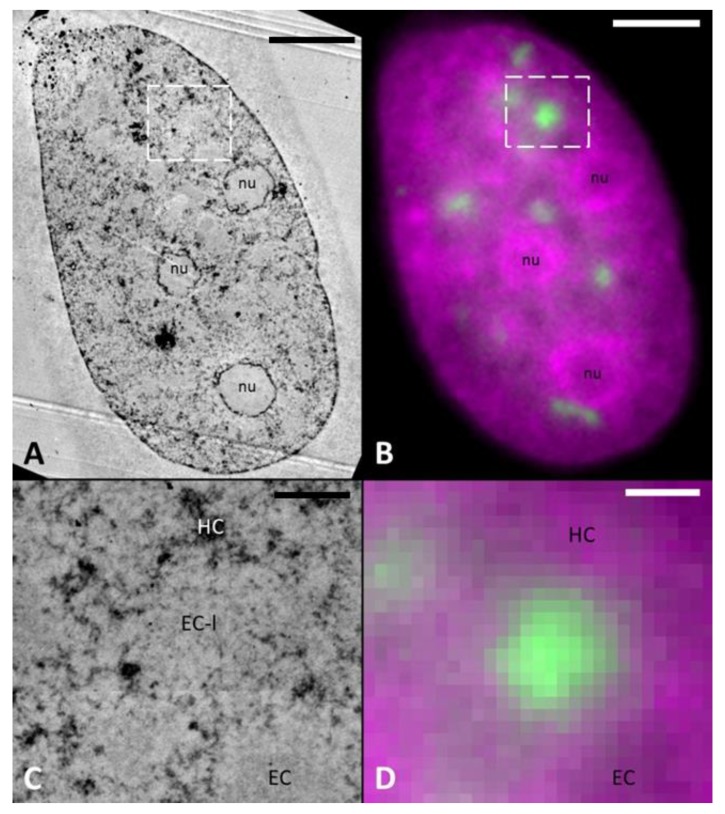
Figure 4.
DNA-specific contrasting with osmium ammine B (OA-B). TEM image of OA-B stained sample (A). (B) Shows the same cell in fluorescence microscopy (53BP1 (green) and DNA (magenta)). Similar to ChromEMT stained sample (Figure 3) no LDA phenotype is visible. 53BP1 focus (D, green) correlates to a EC-like (EC-l) structure (C) and shows a similar DNA density to regular EC. Scale bar: (A,B) 5 µm, (C,D) 1 µm.

