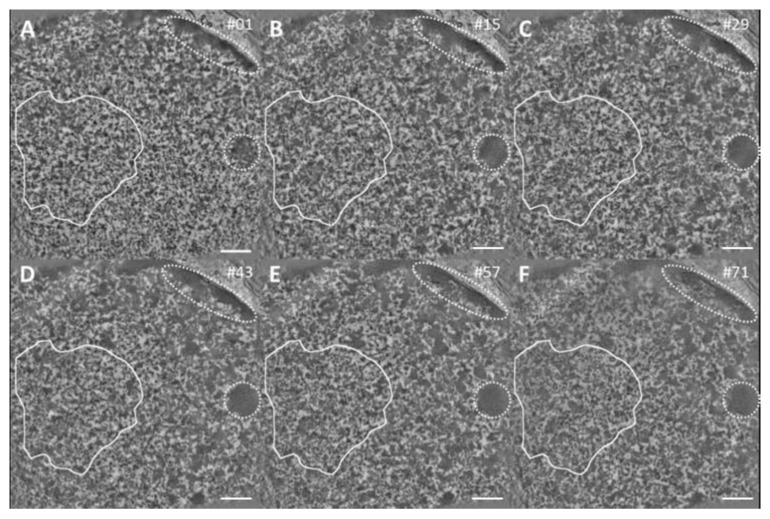
Figure 5.
Tomography of an irradiated area stained by ChromEMT. A gallery of 2 nm thick tomographic slices extracted from a dual axis tomographic reconstruction of 250 thick section of an irradiated U2OS cell. The chromatin structure shows no obvious difference between the inside and outside of the damage site (white outline) through the whole volume. Roundish domains (inside doted areas) indicating HC. For further comparison see Supplemental Figure S5 which shows the tomography of a non-irradiated area. Slice numbers shown in the upper right corner. All scale bars: 500 nm. Slices thickness 2 nm.

