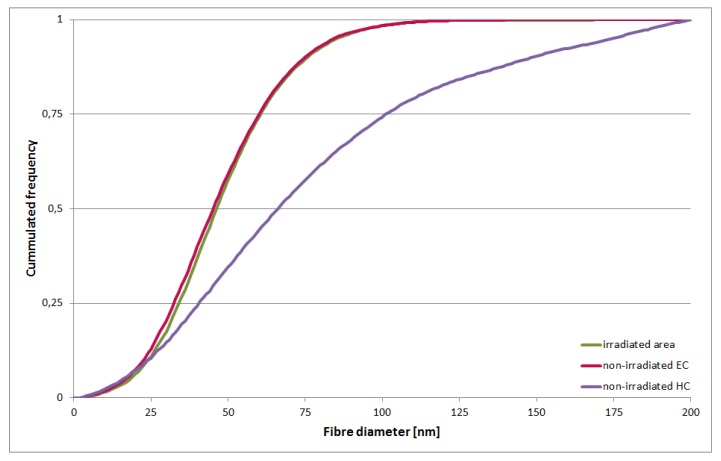
Figure 6.
Cumulative histogram of fiber diameter of irradiated areas (green), non-irradiated EC (red), and HC (purple): Irradiated area shows a distribution of fiber diameters very similar to non-irradiated EC. The HC curve clearly deviates; it shows a higher proportion of fibers with a larger diameter. Each curve contains pooled data and was normalized to the volume. N = 3 images.

