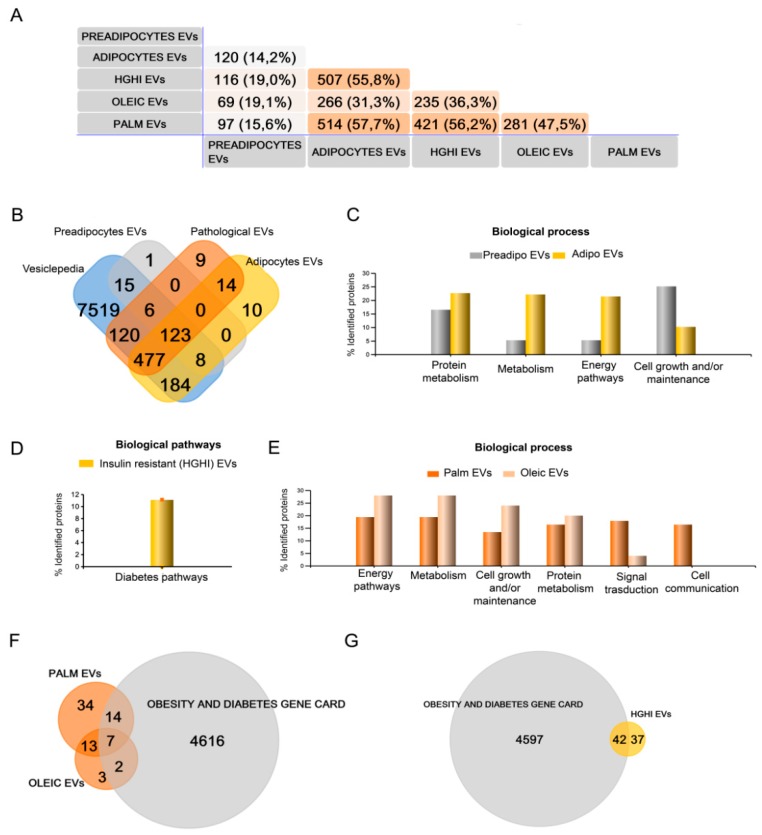
Figure 2.
Qualitative (DDA) mass spectrometry analysis shows that extracellular vesicles (EVs) protein cargo varies with lipid hypertrophy and insulin resistance. EVs isolated from non-differentiated and differentiated adipocytes as control, and also from those treated with palmitate (500 µM, 18 h), oleic acid (1 mM, 48 h), and high glucose (4.5 g/L)/high insulin (5 µg/mL, 48 h) treatment (HGHI) were analyzed by mass spectrometry. A descriptive Venn diagram showing the overall number of proteins identified with an FDR <1% (99% protein confidence) in vesicles isolated from preadipocytes, control differentiated adipocytes, and those from the three pathological cell models (HGHI, palmitate and oleic acid hypertrophy) (n = 4 independent experiments considering only those proteins present in 3 out 4 samples) (A). All identified proteins were also compared to the Vesiclepedia database (B). Funrich functional analysis classification of identified proteins by biological process and pathways is shown (percentages per annotated genes in each class; number of genes in background) for vesicles isolated of pre- and mature adipocytes (C); of HGHI (D), and of palmitate and oleic acid treated cells (E). Venn diagrams comparing the Obesity and Diabetes Gene card database to those proteins exclusively identified (not present in EVs shed by control differentiated cells) in EVs from lipid hypertrophied (F) and HGHI (G) treated adipocytes.

