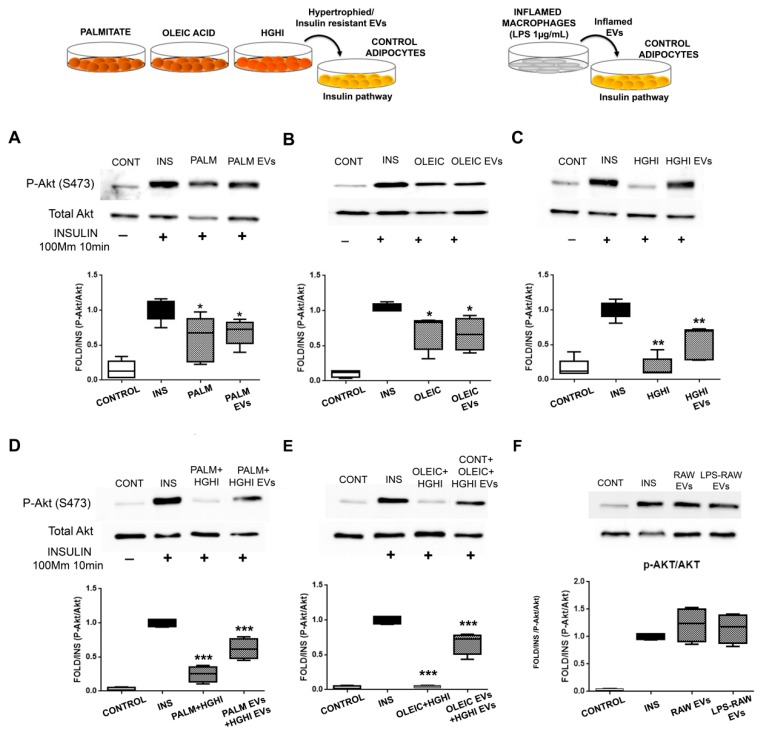
Figure 5.
EVs shed by pathological adipocytes exert insulin resistance in adipocytes. The effect of EVs from lipid hypertrophied (palmitate/oleic), insulin resistant (HGHI) adipocytes (A–E), and EVs from inflamed macrophages (F) on insulin pathway assayed on control adipocytes is shown. Representative images and densitometry of bands expressed toward insulin (10 mM, 10 min stimuli) of P-Akt and total Akt immunoblots ((n = 4 independent lysates) are shown; differences were assayed by one-way Anova-Kruskall Wallis test followed by Dunn´s multiple comparison test (p ≤ 0.05 was considered statistically significant: * p < 0.05, ** p < 0.01, and *** p < 0.001). CONT: differentiated adipocytes without insulin stimulation; INS: differentiated adipocytes stimulated with 10 mM insulin for 10 min; PALM/OLEIC/HGHI: palmitic/oleic-hypertrophied/HGHI treated adipocytes stimulated with 100 mM insulin for 10min; PALM/OLEIC/HGHI EVs: differentiated adipocytes treated (24 h) with EVs shed by palmitate or oleic hypertrophied, or by HGHI adipocytes and then stimulated with 100 mM insulin for 10 min; PALM + HGHI EVs: control adipocytes treated (24 h) with EVs secreted by palmitic hypertrophied cells followed by treatment with HGHI EVs (another 24 h), and then stimulated with 100 mM insulin for 10min; OLEIC + HGHI EVs: control adipocytes treated (24 h) with EVs secreted by oleic hyperthrophied cells followed by HGHI EVs treatment (another 24 h), and then stimulated with 100 mM insulin for 10 min; RAW EVs: control adipocytes treated (24 h) with EVs secreted by control non-inflamed macrophages followed by 100 mM insulin stimulation for 10 min; LPS-RAW EVs: control adipocytes treated (24 h) with EVs secreted by LPS (1 µg/mL, 24 h) inflamed macrophages followed by 100 mM insulin stimulation for 10 min.

