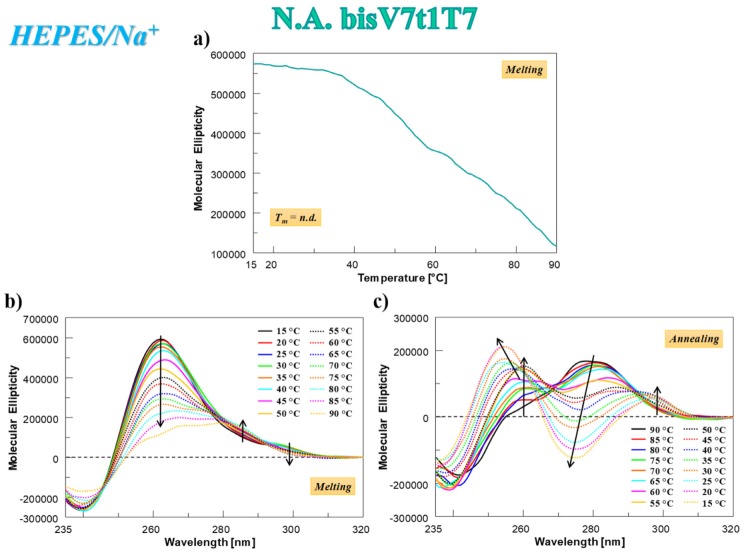
Figure 4.
N.A. bisV7t1T7 at 2 µM concentration in the selected HEPES/Na+ buffer: (a) CD-melting profile, recorded at 262 nm using a scan rate of 1 °C/min; (b,c) overlapped CD spectra recorded every 5 °C during the melting (b) and cooling processes (c). Arrows in panels b and c indicate the evolution of the CD signal over time. n.d. = not determined.

