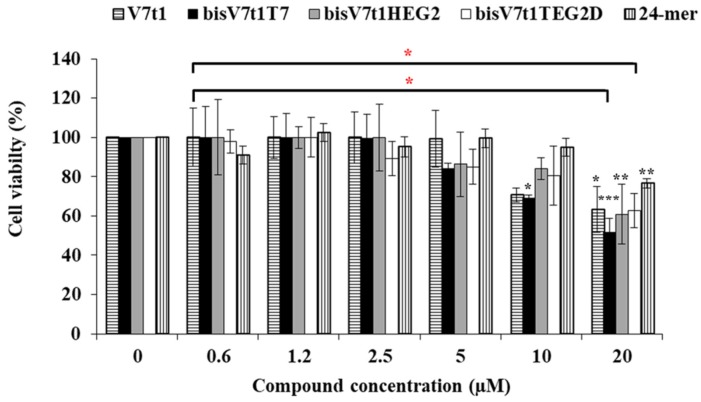
Figure 7.
Cell viability assay of V7t1, bisV7t1T7, bisV7t1HEG2, bisV7t1TEG2D and a control 24-mer on MCF-7 cells tested by MTT assays. Cell viability is reported as the % of live cells with respect to control untreated cells (100% cell viability). Reported results derive from 4 independent experiments. Statistical analysis was performed by using Student’s t-Test by comparing all samples to the control cells (* P < 0.05, ** P < 0.01 or *** P < 0.001) and ANOVA test by comparing all covalent V7t1 dimers to V7t1 (* P < 0.05).

