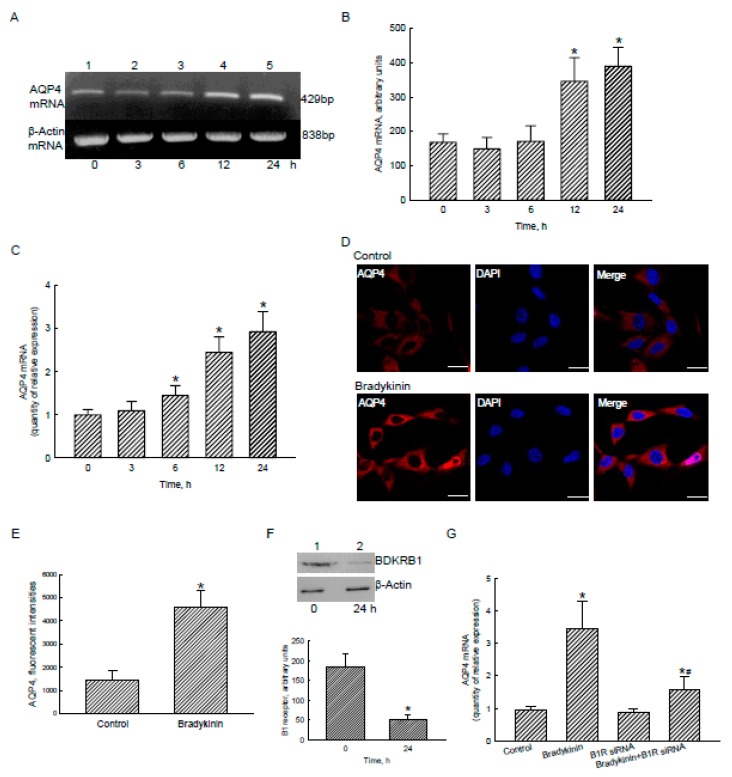
Figure 5.
Effects of bradykinin on aquaporin-4 (AQP4) mRNA and protein expressions in human malignant glioblastoma cells. Human U87 MG glioblastoma cells were treated with 100 nM bradykinin for 3, 6, 12, and 24 h. Levels of AQP4 mRNA were analyzed using an RT-PCR (A, top panel). Amounts of β-actin mRNA were examined as an internal control (bottom panel). These DNA bands were quantified and statistically analyzed (B). Expression of AQP4 mRNA was further quantified using a real-time polymerase chain reaction (PCR) analysis (C). Human U87 MG cells were exposed to bradykinin for 24 h. Levels and distribution of AQP4 were immunodetected (D, left panel). The nucleus was stained with 4’,6-diamidino-2-phenylindole (DAPI) (middle panel). The merged signals are shown in the right panel (D) and were quantified and statistically analyzed (E). Expression of the bradykinin receptor (BDKR) B1 was knocked-down using RNA interference. Control cells received scrambled siRNA. Levels of BDKRB1 were immunodetected (F, top panel). β-Actin was immunodetected as an internal control. These protein bands were quantified and statistically analyzed (bottom panel). Human U87 MG cells were pretreated with BDKRB1 siRNA and then exposed to bradykinin. Expression of AQP4 mRNA was quantified with a real-time PCR (G). Each value represents the mean ± standard deviation (SD), n = 9. Symbols * and # indicate that the values significantly (p < 0.05) differed from the control and BDKRB1 siRNA-treated groups, respectively. Representative DNA agarose gels, confocal images, and immunoblots are shown. Scale bar, 5 μm.

