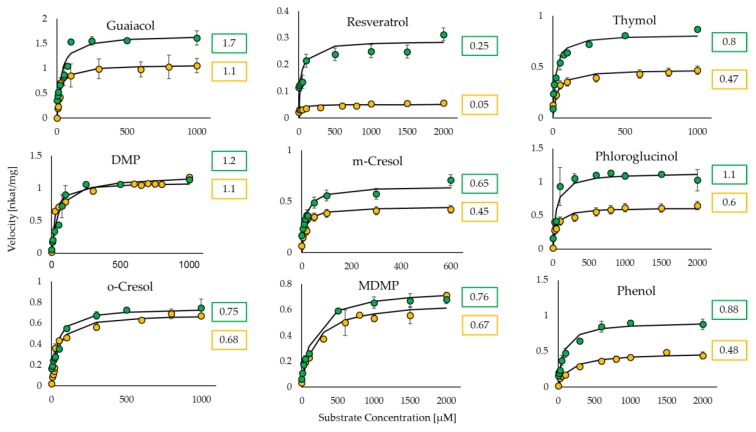
Figure 3.
Graphical representation of the Michaelis–Menten curves for the substrates glycosylated by UGT72B27 quantified with UDP-GloTM assay (yellow) and phosphate GT activity assay (green). The numerical symbols represent the maximum velocity (Vmax) for each corresponding curve with the unit nkat/mg. n = 3.

