Figure 3.
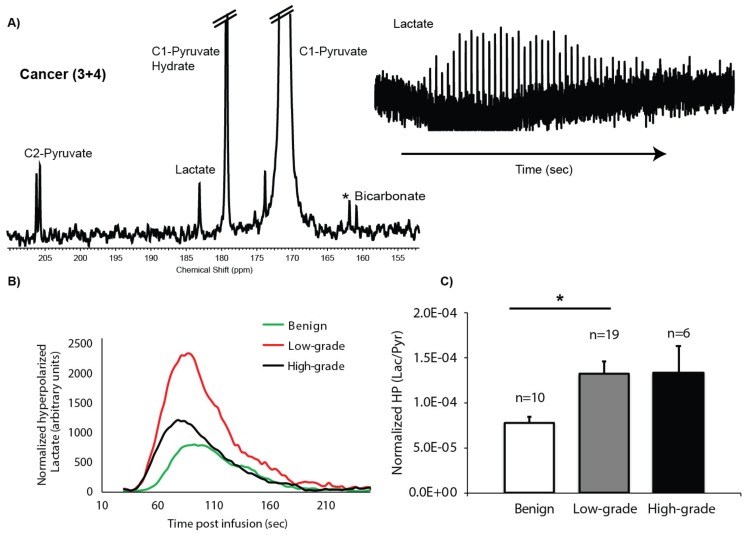
Hyperpolarized (HP) 13C spectroscopy of TSCs. (A) Representative summed 13C spectrum from a TSC containing 44% cancer of Gleason score 3 + 4 post-injection of HP [1-13C]pyruvate (left) as well as the dynamic time course of the HP [1-13C]lactate signal (right); (B) Representative HP lactate kinetics from each type of TSC (benign, low-grade cancer, or high-grade cancer), normalized to the βNTP peak; (C) Bar graph of normalized ratios of AUCLac/Pyr demonstrates a significant difference only between the benign and low-grade cancer TSCs (* indicates p < 0.05).

